This page was last revised for version 5.0.0.
Please help us to keep up-to-date documentation by editing this page directly to fill in any documentation gap. Do reach out if you need assistance!
SNT Commands
SNT registers commands in Fiji’s menu structure in the Plugins › Neuroanatomy sub-menu, namely:
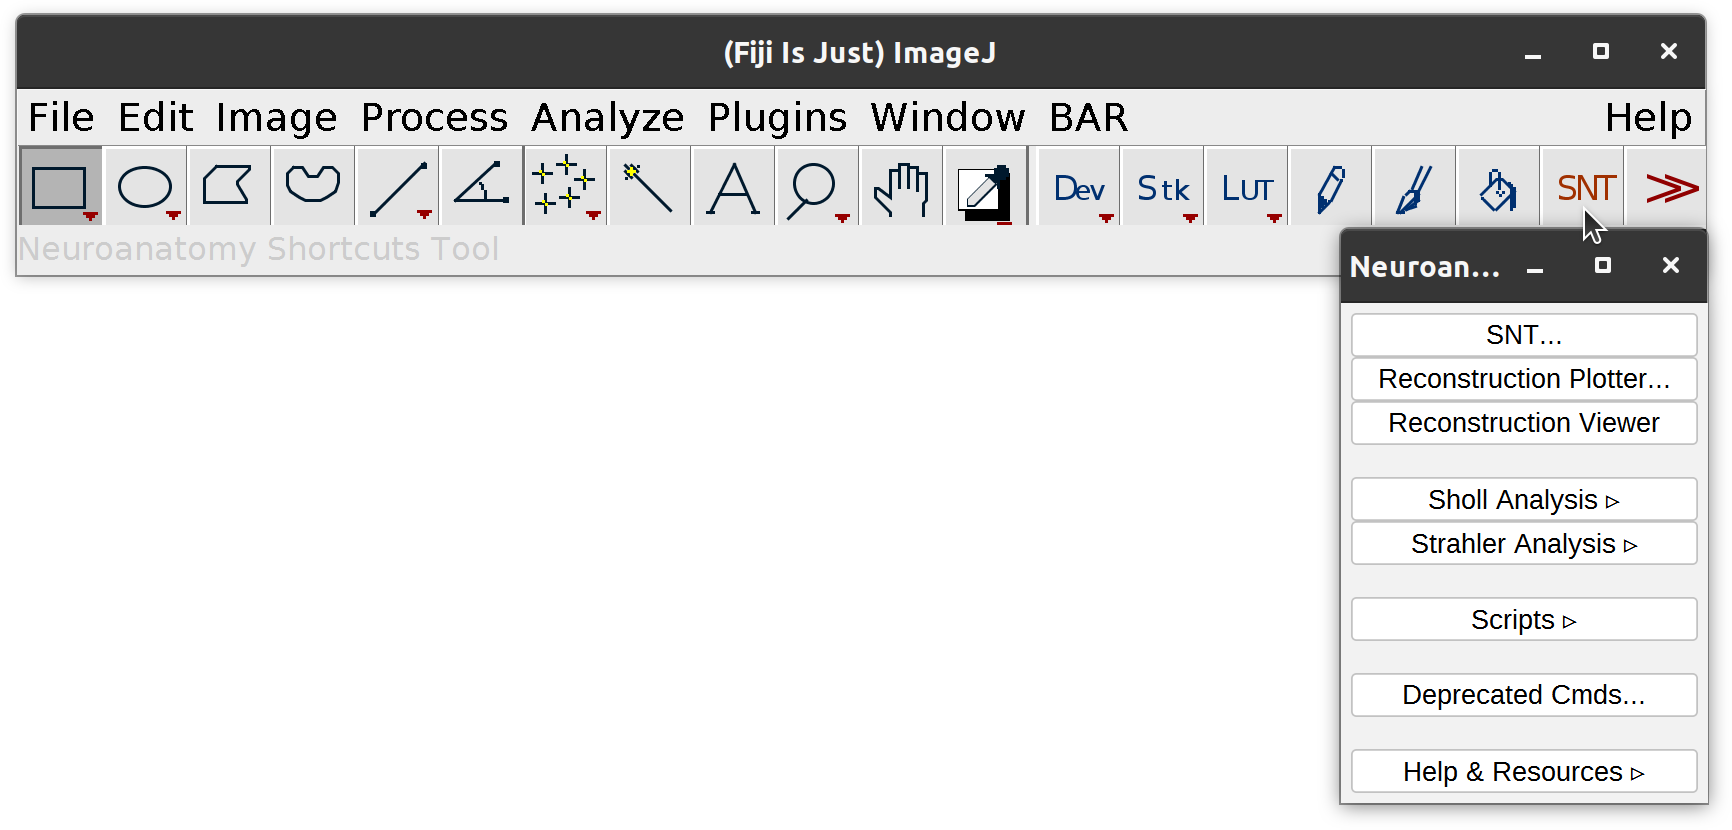
Neuroanatomy Shortcuts Window A toolbar panel listing most SNT commands, actions, and scripts including entry points to Sholl and Strahler analyses. It can be open via Plugins › Neuroanatomy, or more easily, by pressing SNT in the ImageJ toolbar:
SNT… The main interface, from which tracing and path editing operations are done
Rec. Viewer A fast, streamlined 3D viewer for analysis and quantification of existing neuroanatomical data
Reconstruction Plotter A utility for rendering 2D illustrations of reconstructions (including vector formats) without having to load other interfaces
Startup Prompt
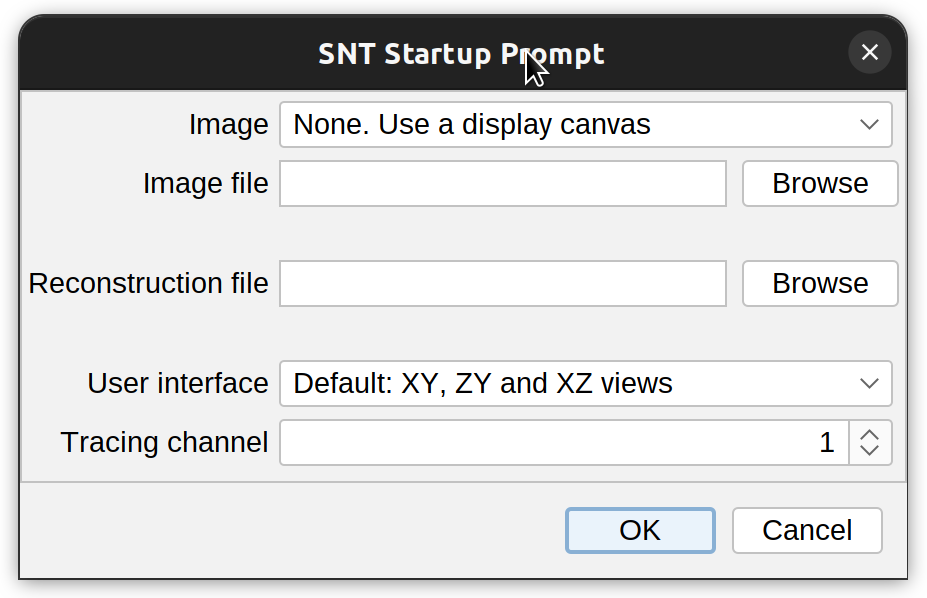 SNT is initialized by running Plugins › NeuroAnatomy › SNT…. All the options in the startup prompt can be set once SNT is opened, but the startup prompt provides the convenience of setting the most important parameters at once.
-
Image/Image file The image to be traced/analyzed. The drop-down menu will list all images currently open in ImageJ. Alternatively, an image path may be specified by clicking Browse and choosing an image file. If no image is chosen, SNT will create an empty display canvas from the computed bounding box of the reconstruction file (if provided).
-
Reconstruction file The path of the reconstruction file to be imported. SNT will automatically try to fill this field by looking at all the reconstruction files (.traces, .swc, .ndf, or .json) in the image directory and retrieving the filename closer to Image file.
-
User interface Specifies which views to display for 3D images. The default setting provides the XY, ZY, and XZ views and allows for more accurate node placement but requires more RAM.
-
Tracing Channel Specifies the image channel to trace on (this option is ignored with single-channel images).
Main Dialog
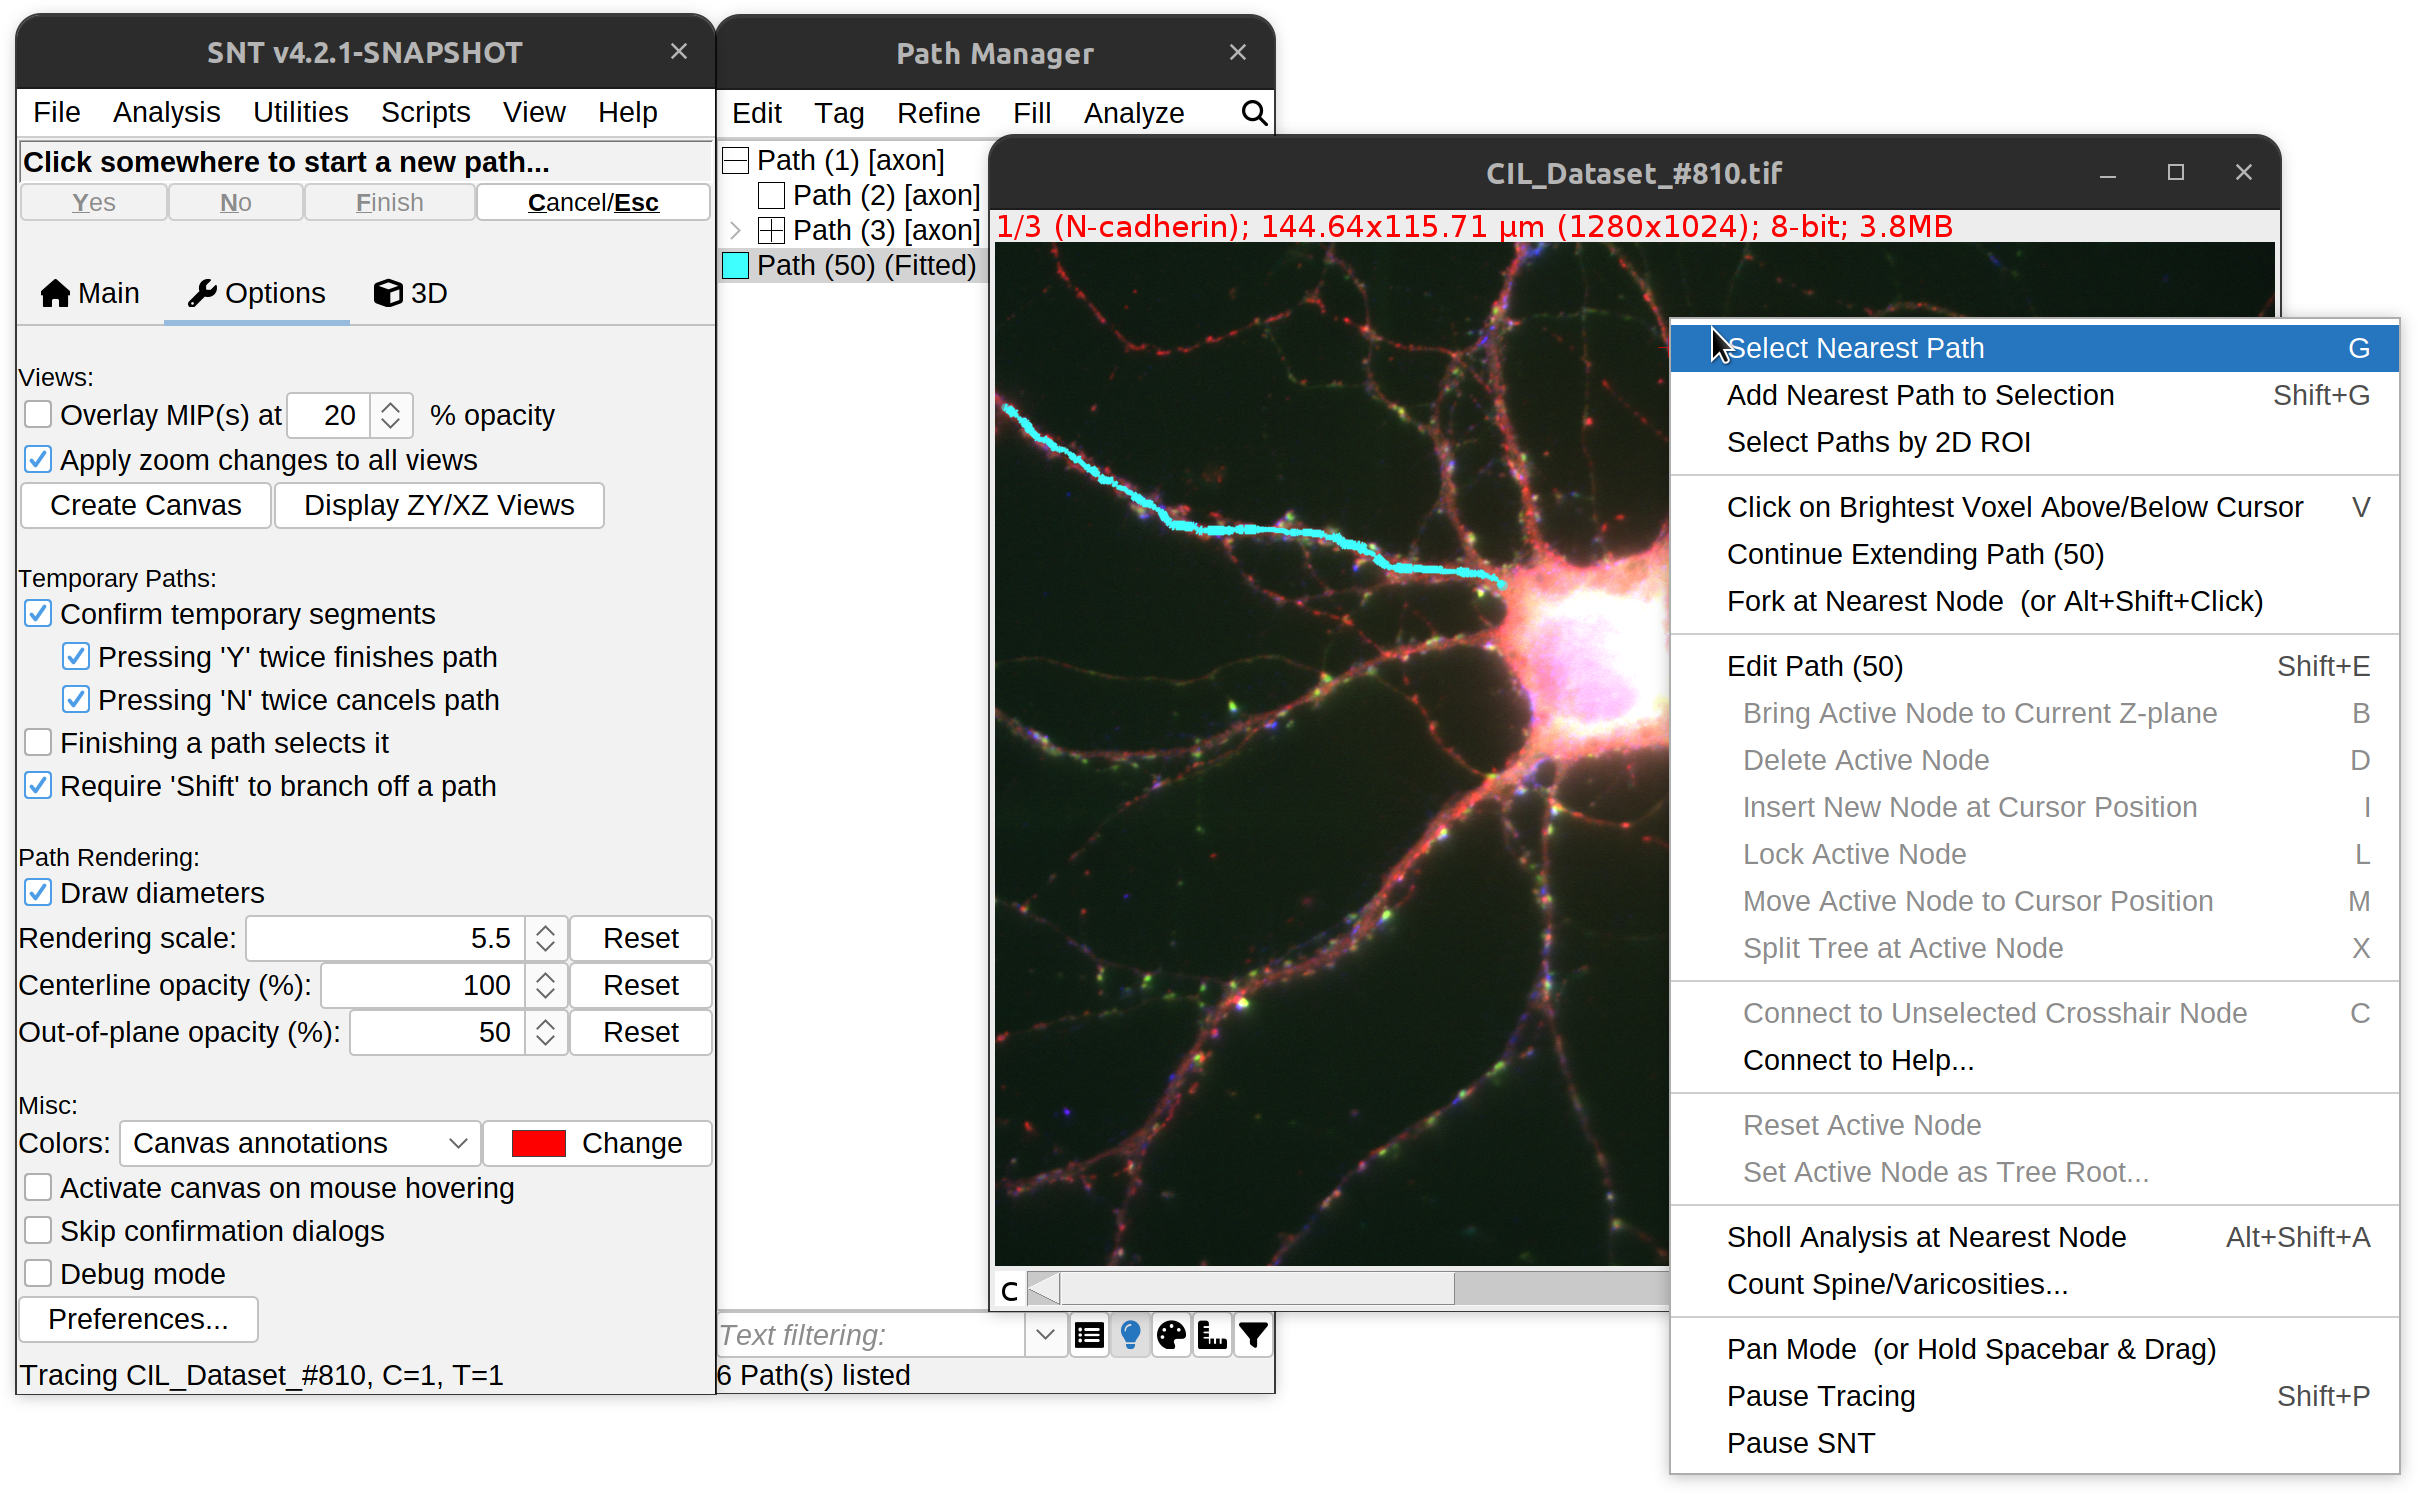
Overview of main dialog (left). Note that clicking on the headings separating the different widgets will point your browser to the relevant section of this manual!
Menu Commands
File ›
Lists commands for I/O operations. Most are self-explanatory. Noteworthy:
Choose Tracing Image…
Specifies the image to trace on without having to restart SNT. Commands include:
- From Open Image… Use this to staring tracing on an image already open in Fiji. It allows selection of an image from a a prompt listing all images currently open
- From File… Allows browsing for an image file
- From System Clipboard Loads a 2D image from the system clipboard. Useful, to e.g., trace on forum-posted images
In either scenario. You should toggle the validate spatial calibration checkbox to ensure the image to be imported is compatible with the existing one.
Autotrace Segmented Image File…
If you have a binary mask of the image you want to trace saved to disk (i.e., a pre-processed version of the image in which background pixels have been zeroed), you can use this command to attempt automatic reconstruction. This is similar to Utilities › Autotrace Segmented Image… but uses file paths as input. See Full-automated tracing walkthrough for details.
Load Tracings ›
Imports of neuronal reconstructions from multiple sources, including:
-
Local Files TRACES, SWC (single files or bulk import of a directory of files), NDF (NeuronJ data format), or JSON.
-
Remote Databases Import of neuronal reconstructions from FlyCircuit, InsectBrain, MouseLight, and NeuroMorpho.
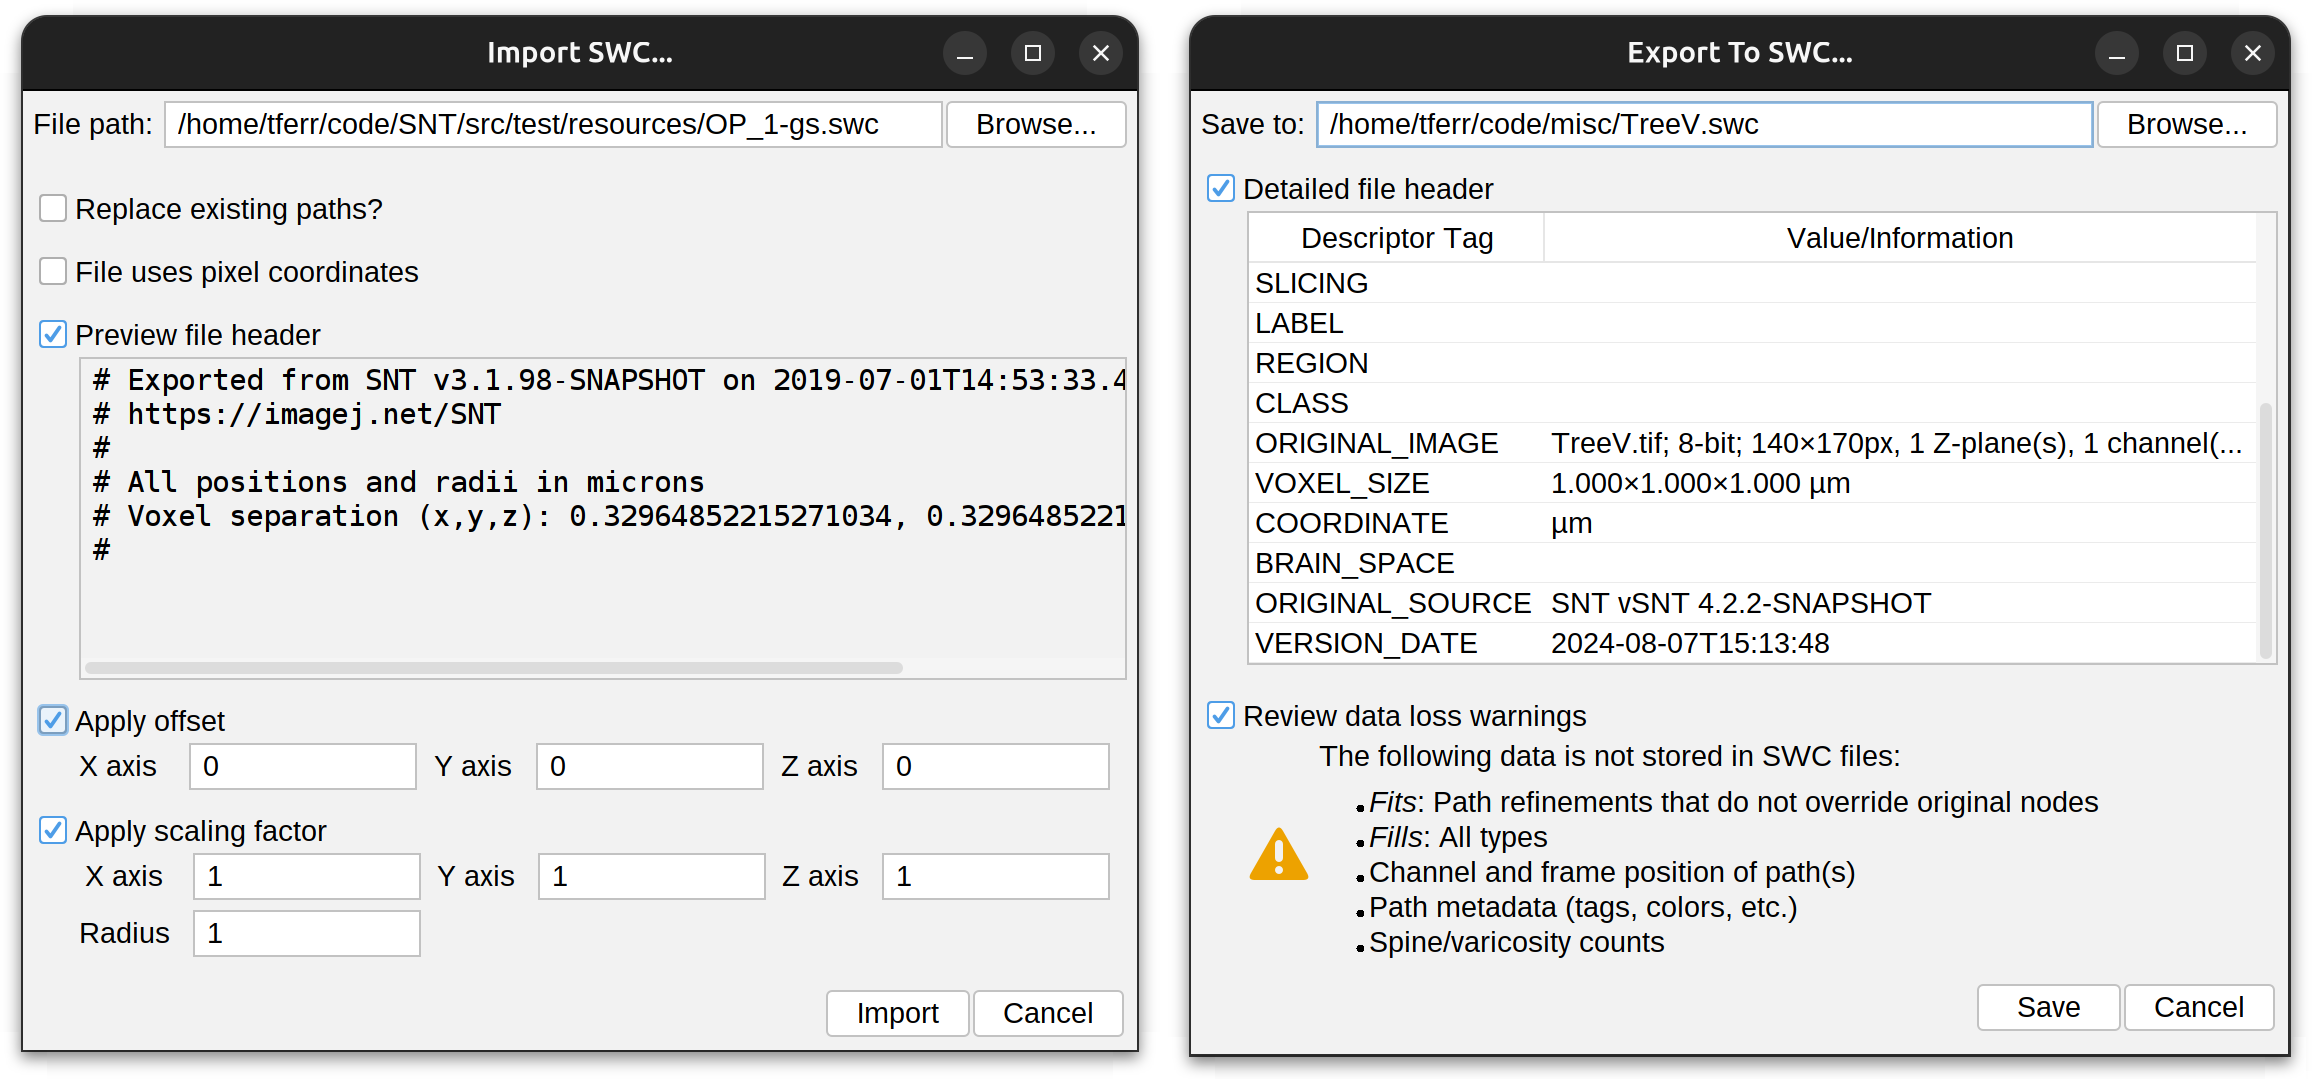
Prompts for importing and exporting SWC files
All SNT dialogs (including the Neuroanatomy Shortcut Window support drag-and-drop: E.g., you can import SWC files just by dragging and dropping them either into the main SNT dialog or the Path Manager.
Load Labels (AmiraMesh)…
 This option assumes you are tracing on the same spatial coordinates of an annotated neuropil for which compartments have been segmented (labeled) and stored in an Amira labels file. Once loaded, SNT will report the name of the compartments in the ImageJ status bar when hovering over the image.
Load Demo Dataset…
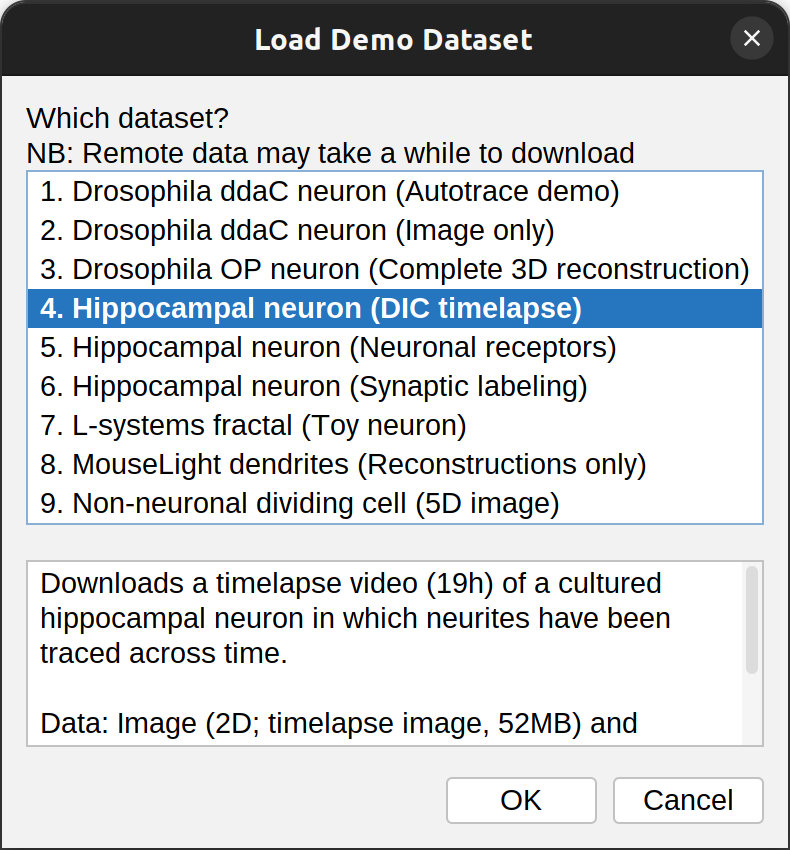
Loads a demo dataset (a tracing image, a reconstruction, or both). Use this to familiarize yourself with the software, explore Walk‑throughs, and to create Minimal reproducible examples when reporting problems. The bottom part of the dialog describes each dataset including source, citation, and DOI (when available). Note that while some of the data is bundled with SNT, the majority of the datasets is downloaded from remote servers (internet connection required).
Save Tracings ›
Options to save/export all of traced paths in the SWC and TRACES formats. Note that it is also possible to export subsets of paths using the Path Manager. This menu also includes controls to create SNAPSHOT BACKUPS. To use this feature:
- Trace one more paths
- Save them to a local file using ⌃ Ctrl / ⌘ ⌃ Ctrl on a PC ⌘ command on a Mac + S (File › Save Tracings › Save)
- Keep tracing paths. When pertinent, press ⌃ Ctrl / ⌘
⌃ Ctrl
on a PC
⌘ command
on a Mac
+ ⇧ Shift + S (Save Tracings › Save Snapshot Backup) to save current progress to a timestamped backup file
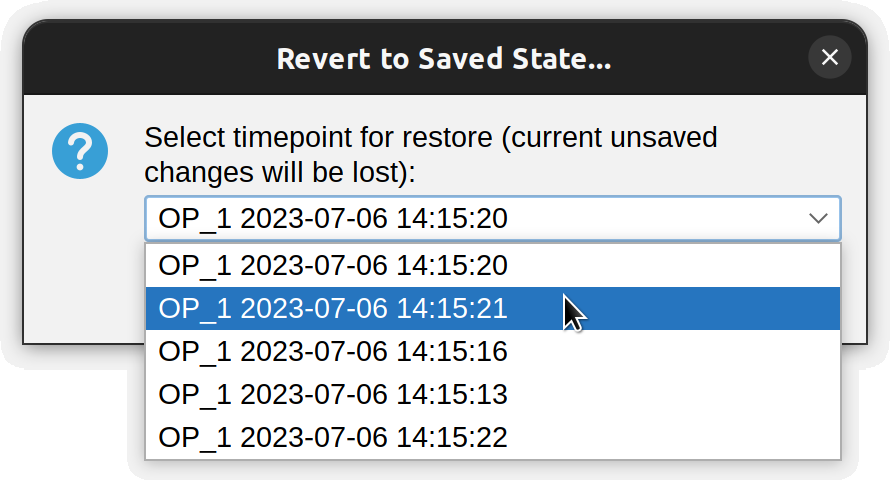
- Reinstate progress from backed up data using File › Restore Snapshot Backup, which allows you to go ‘back in time’:
Save Tables & Analysis Plots…
Allows saving of any measurements and plots generated by analysis commands. Tables are saved in the Comma-separated values file format.
Reveal Directory
Convenience shortcuts to open common directories (scripts, backups, folder of image being traced, etc.) in the native file explorer.
Reset SNT and Restart…
Resets all preferences and restarts SNT using default options. It is recommended to reset SNTs after a major version release.
Analysis ›
Atlas-based ›
See Analysis › Atlas-based Analysis.
Path-based ›
See Analysis › Path-based Analysis.
Convex Hull
See Analysis › Convex hull Analysis.
Persistence Homology
See Analysis › Persistence Homology Analysis.
Root Angle Analysis
See Analysis › Root Angle Analysis.
Sholl Analysis…/Sholl Analysis (by Focal Point)…
See Analysis › Sholl Analysis.
Strahler Analysis…
See Analysis › Strahler Analysis.
Measure…
Provides a comprehensive selection of measurements to apply to one connected component (i.e., rooted tree structure) from the Path Manager. See Analysis › Measurements for details.
Quick Measurements
Shortcut for running Measure… with common metrics.
Utilities
Command Palette
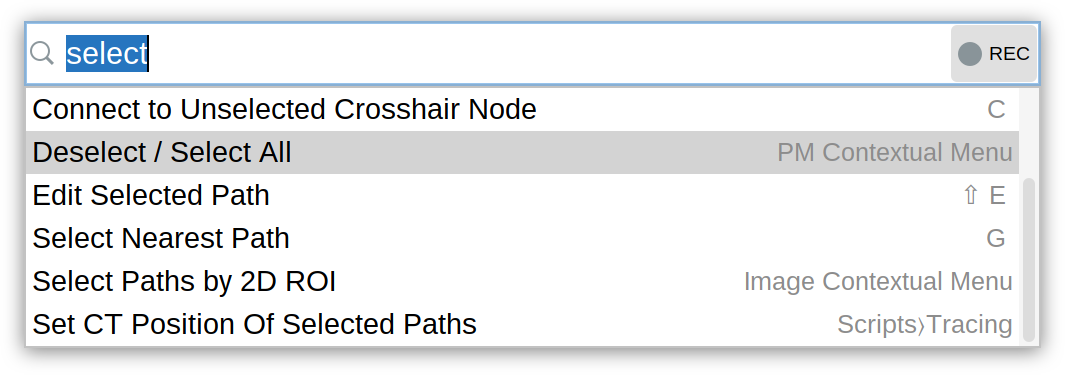 The Command Palette is the fastest way to access actions and discover their respective shortcuts:
- Press ⌃ Ctrl / ⌘ ⌃ Ctrl on a PC ⌘ command on a Mac + ⇧ Shift + P in either SNT or Reconstruction Viewer
- Start typing to filter actions, scripts and available commands
- Press ↑ Up or ↓ Down (or use the
Mouse Wheel) to select a command
- Press ↵ Enter to run it. If the record button is toggled, executed commands are recorded by the Script Recorder.
By default, commands and actions are filtered using approximate string matching. Exact matching can be enabled by toggling the Match Case/Whitespace buttons. Press the button to display the Command Palette above all windows. Press the button to keep the Palette open after running a command.
Compare Reconstructions/Cell Groups…
Allows morphometric comparisons of two single reconstruction files or multiple groups of reconstruction files (including statistical reports and two-sample t-test/one-way ANOVA analysis). Color-coded montages of analyzed groups can also be generated. See Comparing Reconstructions for details.
Create Dendrogram
Generates a Dendrogram plot of a connected component (i.e, one rooted tree structure in the Path Manager). See Analysis › Graph-based Analysis for details.
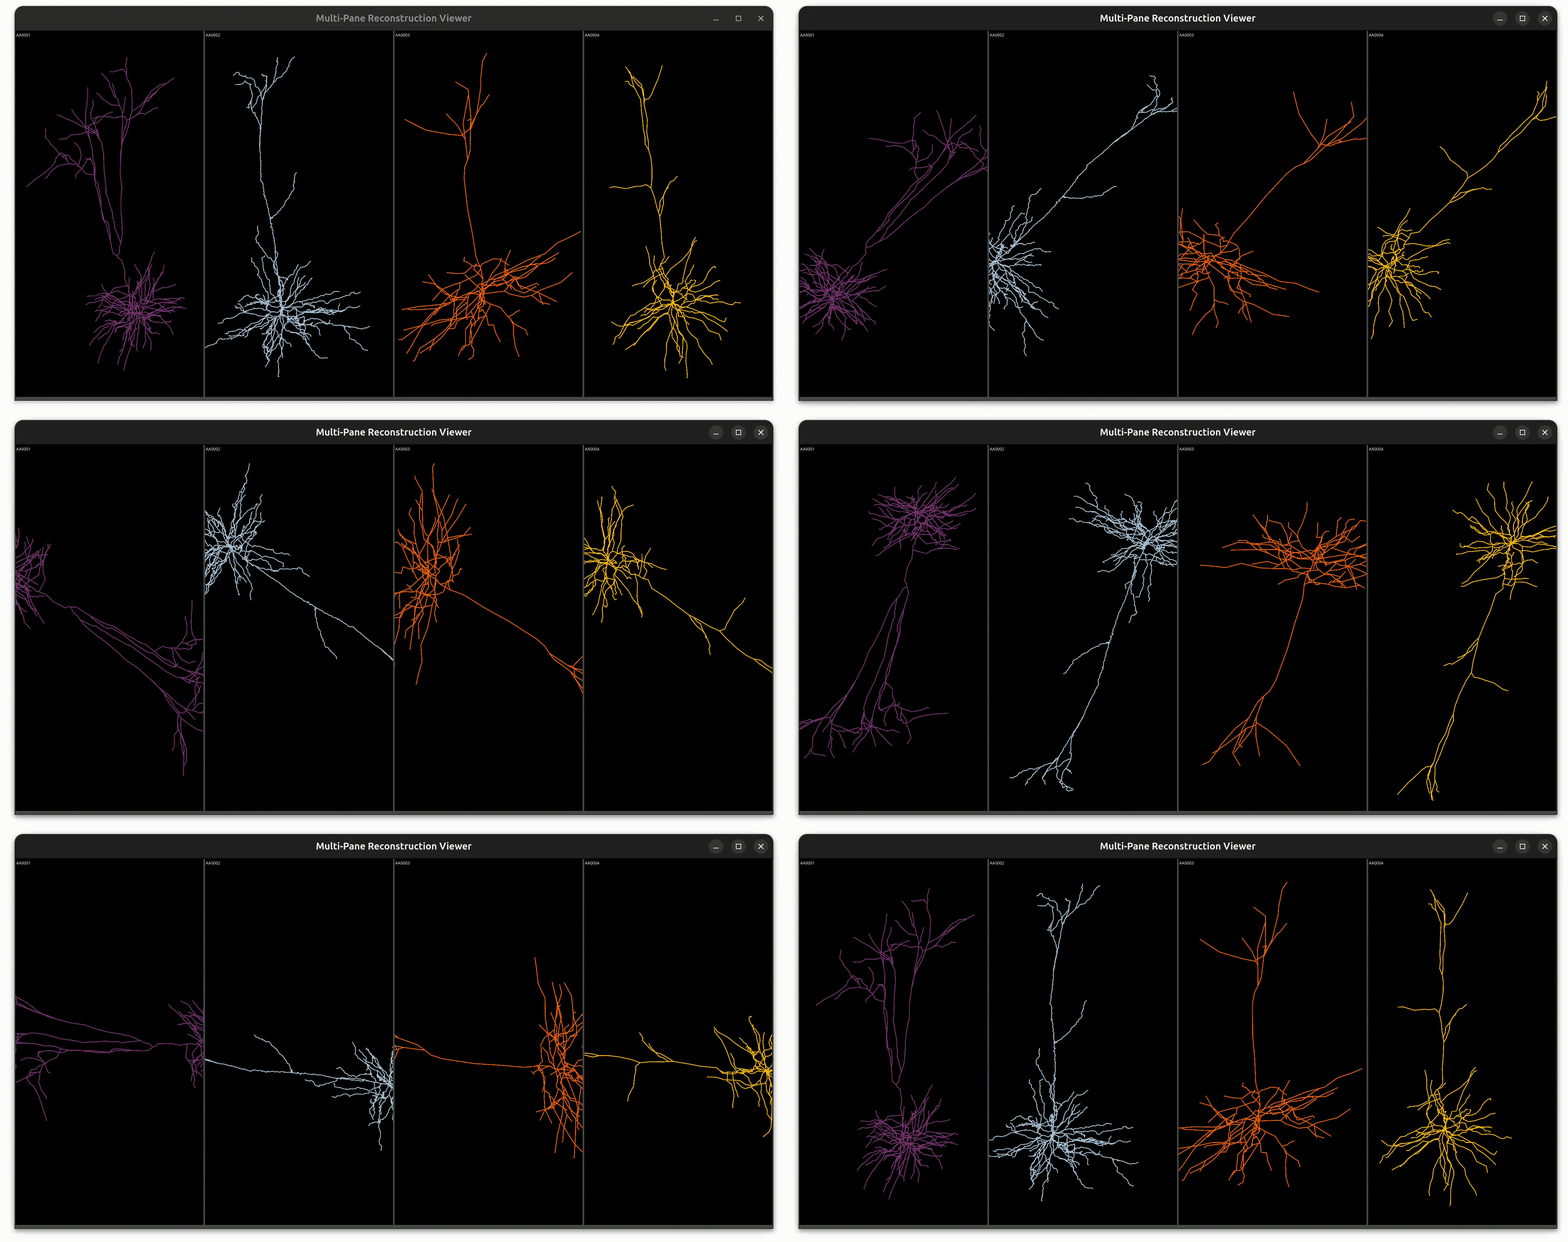
Create Figure…
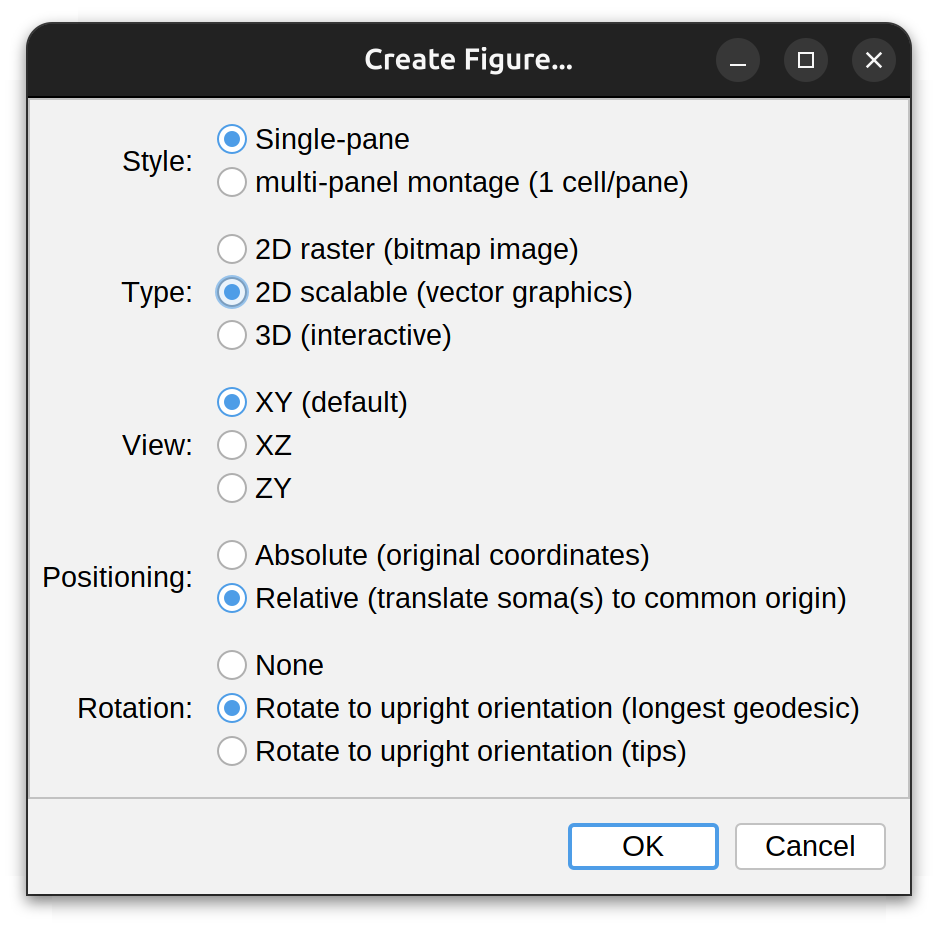 Creates multi-panel figures from chosen reconstructions, according to the following options:
- Style: Whether cells should be rendered in a single pane or in a multi-panel montage with 1 cell per pane. This option is only available when multiple cells exist
- Type: Whether the illustration should be a bitmap image (typically rendered at 1micron per pixel); a scalable graphics 2D image (see Reconstruction Plotter), or an interactive 3D scene (see Reconstruction Viewer)
- View: The display plane of the scene: XY (the default), XZ, or ZY. This option pertains only to static 2D scenes
- Positioning: Whether reconstructions should be rendered under the original coordinates, or whether every cell in the scene should be translated to a common xyz coordinate (0,0,0). This option is only available when multiple cells exist
- Rotation: Whether cell(s) should be rotated to a guessed ‘vertical’ position. Options include:
- None: No rotation is performed
- Longest geodesic: Assumes the longest shortest path in the arbor reflects its overall orientation. May be best suitable for polarized architectures (e.g., dendrites of pyramidal cells)
- Tips: Assumes the vector defined by the soma and the centroid of all tips in the arbor reflects its overall orientation. May be best suitable for symmetrical or radial architectures (e.g., dendrites of starburst amacrine cells)
Reconstruction Plotter
Reconstruction Plotter is a whole-purpose 2D viewer for neuronal reconstructions by plotting 2D projections of traced paths. Its major ability is to produce publication-quality (vector-based) renditions of neuronal reconstructions. A control panel allows for adjustment of the spatial orientation of the tracing. By default, the plot is monochrome. If paths are assigned color tags, or the structure has been color-coded use Actions › Render final (colorized) plot from the control panel to render a (static) plot with color-mapped paths, with the final orientation matching that of the dynamic plot. Features (accessed via plotter’s contextual menu) include:
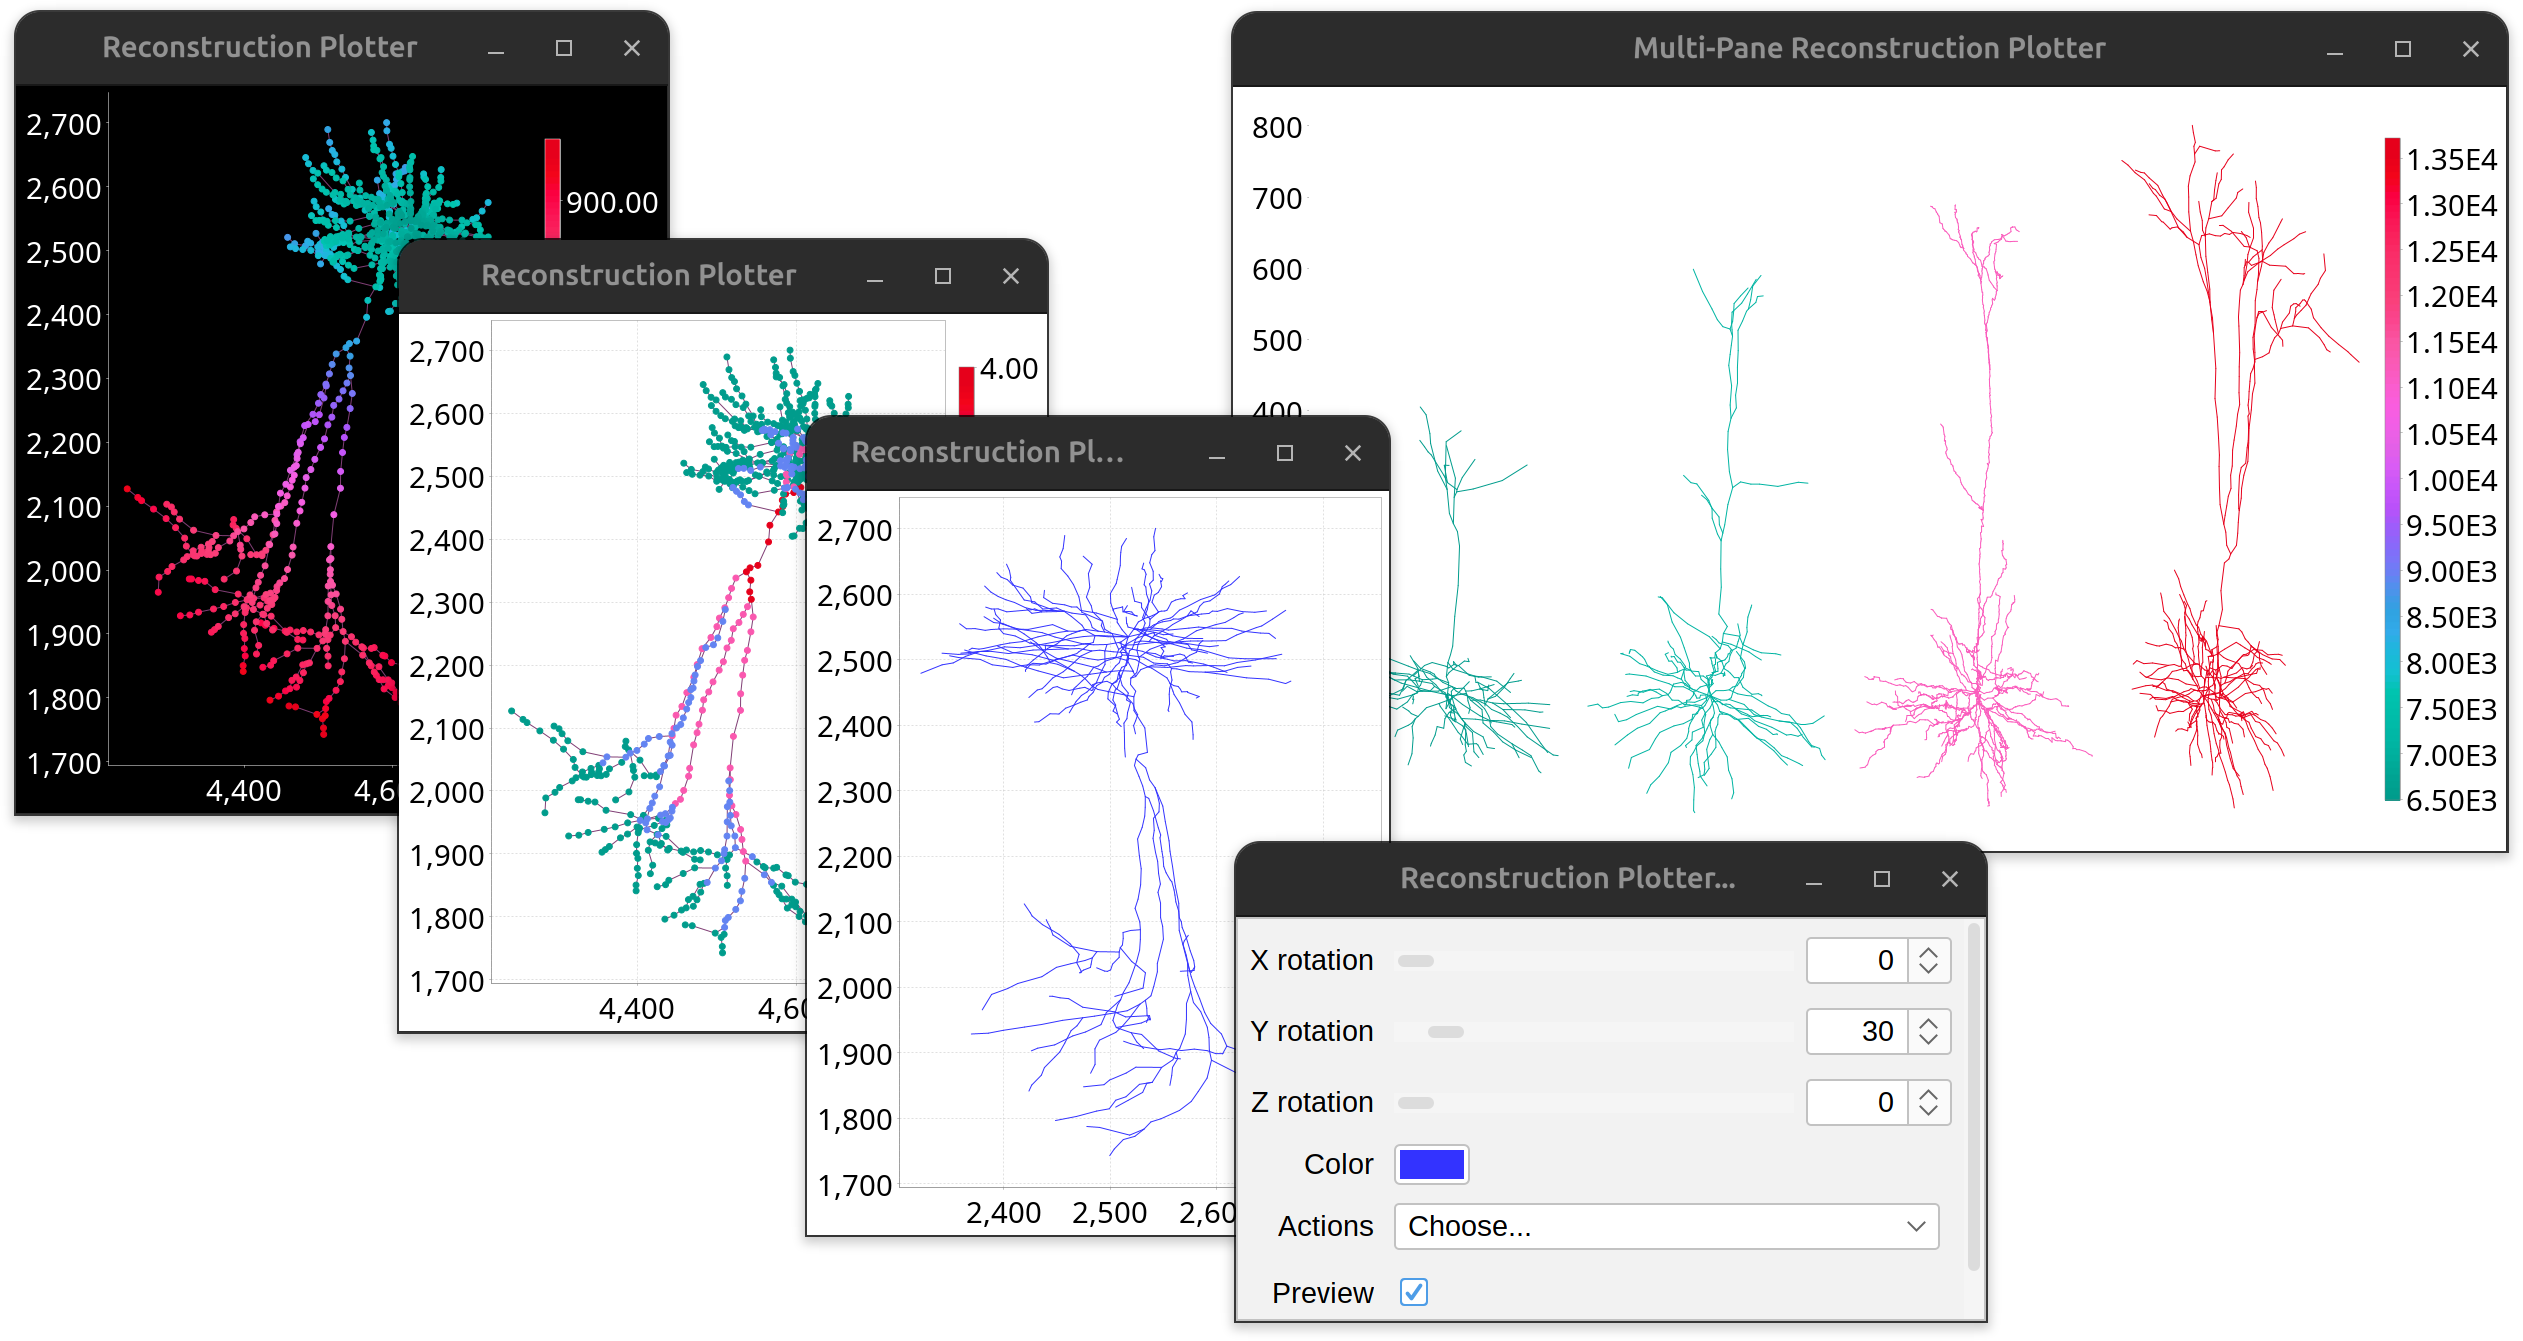
- Dark/light theme
- Customization controls for font, axes, etc.
- Export as PDF or SVG (vector graphics)
- Color legends when color mappings are present
- Can be combined in multi-panel viewers (mainly via scripting)
Autotrace Segmented Image…
Similar to File › Autotrace Segmented Image File… › but using image(s) already open as input. See Full-automated tracing walkthrough for details.
Scripts›
Commands listing bundled and local scripts, as well as access to SNT’s Script Recorder. See SNT: Scripting for details.
View›
Contains commands for organizing tracing views on screen, plus commands for displaying cached data used for computation of paths, including:
-
Arrange Dialogs Resets the on-screen positions of dialogs and widgets.
-
Arrange Tracing Views Resets the on-screen positions of tracing views.
-
Hide Tracing Canvas › Allows toggling of the visibility of the three orthogonal view tracing panes as well as the Legacy 3D View window.
-
Display Secondary Image Displays the cached filtered image being used as secondary tracing layer.
-
Toggle Fiji Console Toggles the visibility of Fiji’s Console. The console displays errors and exceptions as well as informational messages when Debug mode is activated.
Main Tab
This home tab aggregated widgets for tracing and frequent operations.
Data Source
 If tracing on a multidimensional image (i.e., one with multiple channels and/or multiple time points), a particular channel/frame can be loaded into the views by selecting each and pressing the “Reload” button. By default, new values need to be confirmed in a confirmation prompt. If this is too cumbersome, the Auto-load CT position of new paths option automatically loads the active channel/frame when a new path is started. Note that this option may not be compatible with secondary layers and Z-projection overlays.
Cursor Auto-snapping
Enable Snapping If active (the default) the cursor snaps to the brightest voxel in its vicinity (Toggling shortcut: S). To accomplish this, SNT takes the cuboid of the specified dimensions (in pixels) centered on the current cursor position, searches quickly for local maxima in that neighborhood, and moves the cursor to that position. The Z-plane in which the maximum was found is automatically selected if the “Z” parameter is greater than 0. Noteworthy:

-
This feature assumes the signal is brighter than the background as typically found in fluorescent images.
-
If multiple maxima exist (e.g., when the signal is saturated), it snaps to their centroid.
-
To streamline the computation: XYZ dimensions are constrained to even numbers and limited range.
-
Snapping occurs in 2D (i.e., in the active plane) if Z=0.
-
The XZ, ZY views are synchronized when 3D snapping is active (i.e., Z>0).
-
This functionality was inspired by NeuronJ, that described it like this in its manual:
To facilitate accurate positioning of starting points, so that they are really on a neurite rather than close to one, the program carries out a local snapping operation. This means that when moving the mouse within the image, the program quickly searches in a small window around the current mouse position for the pixel that is most likely to be on a neurite.
Auto-tracing
-
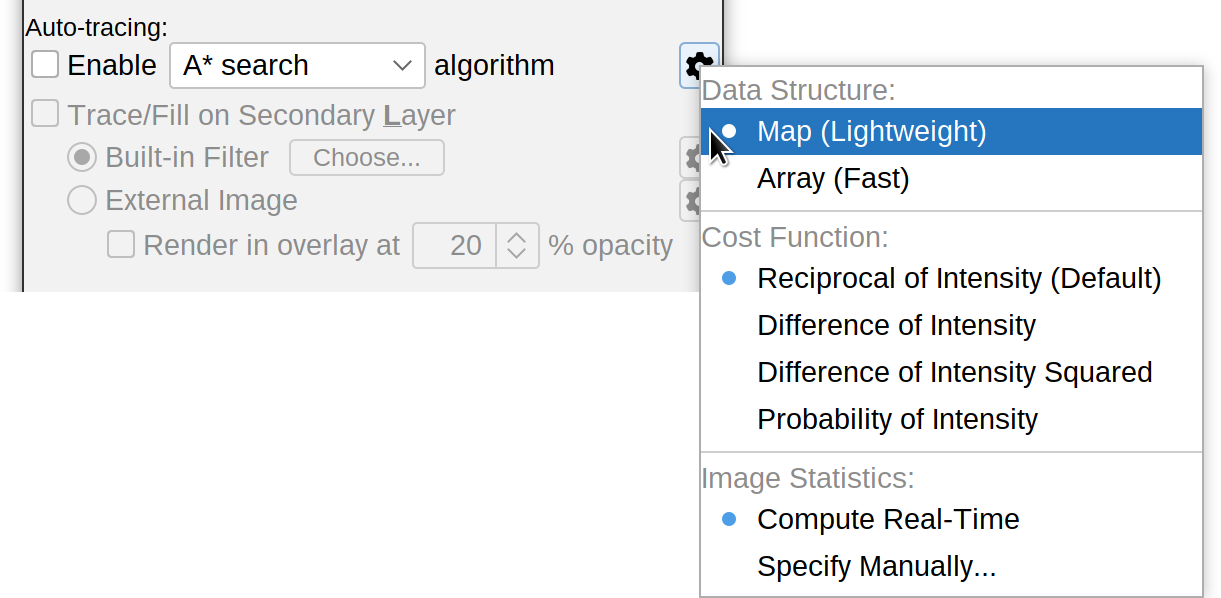
Enable A* search algorithm By default, SNT uses the A* search algorithm to automatically trace paths between two manually selected points. To manually place nodes along a path, toggle this feature off. Note that it is also possible to enable other built-in algorithms or algorithms provided by external SNT add-ons. Current options include:
-
A* search: Canonical and proven implementation of the historic algorithm, ported from Simple Neurite Tracer
-
NBA* search (New Bidirectional A*): Newer implementation of A* expected to be faster than original but not as thoroughly tested
-
Fast marching: Provided by Tubular Geodesics, an external SNT add-on
Independently of the algorithm used, the algorithm drop-down menu in this pane provides options to tweak the performance, accuracy and efficieny of the computations involved in the search. These include:
-
Data structure Defines how data is stored internally: Either Map (slightly slower, but lower computation footprint), or Array (slightly faster, but higher footprint)
-
Cost Function Auto-tracing algorithms aim to find a path to the destination node under the smallest cost of deviating from the signal along a neurite. A successful search between two points is thus the cheapest path with the least deviations. This is implemented through a cost function in which voxels along a neurite are assigned lower costs, while voxels outside the neurite are assigned higher costs or penalties. SNT implements several cost functions, namely:
-
Reciprocal of Intensity The default, robust under a wide range of conditions
-
Difference of Intensity Fast on images with right-shifted histograms (mean » 0)
-
Difference of Intensity Squared (Usually) Faster flavor of Difference of Intensity
-
Probability of Intensity Fast, specially on noisy images. To be used with ‘Real-time statistics’ (see below)
-
-
Image Statistics Successful cost functions rely on a priori understanding of the image (simpler cost functions may only require access to the image minimum (dimmest intensity) and maximum (brightest intensity), but many others may need access to the image’s mean, standard deviation, etc.). Options include:
-
Compute Real-Time The default. Image statistics are computed during each auto-tracing operation, along a bounding-box defined by the start and end points of the search
-
Specify Manually Advanced option for users with a quantitative understanding of the image. Searches may consider pixels outside neurites when maximum in over-estimated, and may take significantly longer when it is under-estimated, since each pixel will carry a greater-than-reasonable cost
-
Compute Once Statistics are computed once for the whole image (may take a while for large images) and stored in memory. If enough RAM is available this may speed up searches. Although in real-word usage any speed-gains relatively to Compute Real-Time seem negligible on modern hardware
-
-
Tracing on Secondary Image (Layer)
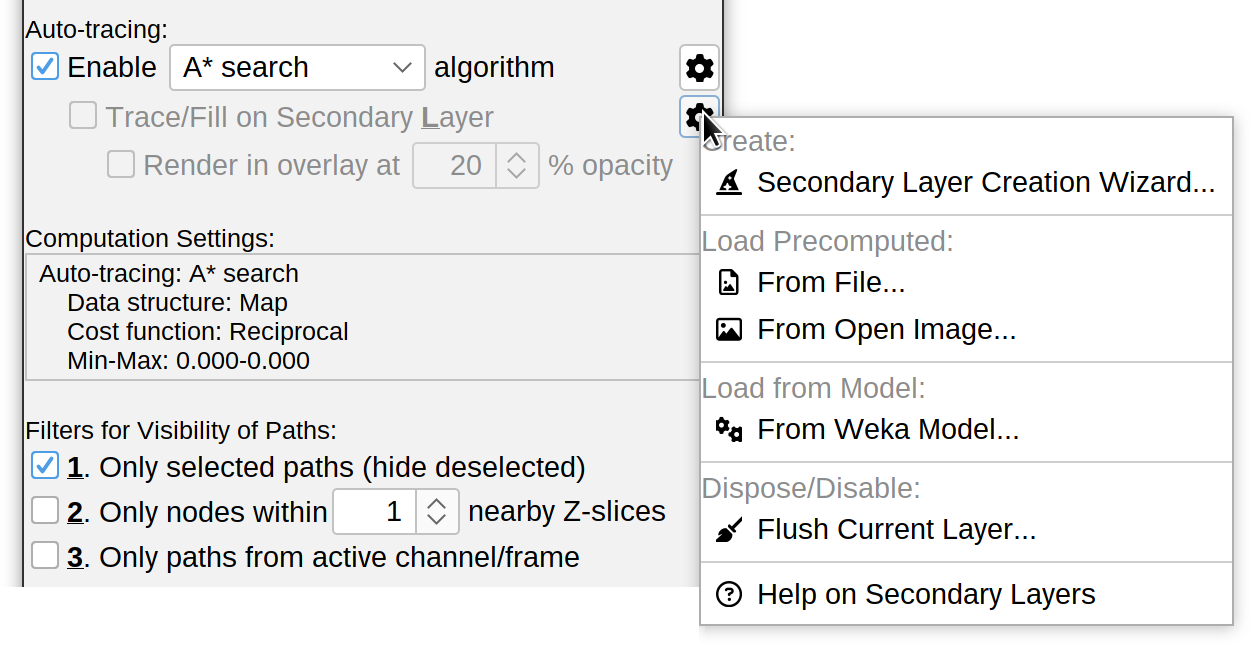 This is one of SNT’s most advanced and useful features. The default auto-tracing provides an immediate way to detect structures by their likelihood of belonging to a tube-like structure (such as a neurite). However, it is just one approach for “tube-like” classification. What if your data requires different filtering?, or you want to experiment with other approaches?, or the perfect processing algorithm for your images is not yet available in SNT?
Tracing on Secondary Layer is the answer to these questions: It allows you to feed SNT with a pre-processed image on which the A* star search will operate. Because this option can be toggled at will, it becomes a secondary layer for auto-tracing: E.g., you may decide to auto-trace certain neurites on the original image, while tracing other neurites on the secondary layer.
For the most part, the secondary layer remains hidden because feedback on auto-tracing searches is always provided in the original image. When RAM is not limited, one can ping-pong between secondary and original image simply, by pressing L, the shortcut for the Trace/Fill on Secondary Layer checkbox. Here are some specific usages for this feature:
-
Frangi Vesselness filtering For certain datasets Frangi filtering is quite effective at enhancing tubular structures. However, it is more computation intensive, and thus, less suitable to be adopted by “compute-as-needed” approaches. Thus, Frangi-filtering can be computed once for the whole image, and the result loaded as secondary layer
-
Image Processing at multiple scales Consider a structure formed simultaneously by very thick and very thin processes (e.g. axons and dendrites). To trace structures of variable diameters more effectively, one could pre-filter a copy of the current image at multiple scales, and load the result as secondary layer
-
Probability maps (p-maps) Probability maps of classified images (generated using e.g., machine learning) may not be 100% accurate. We find that, in many cases it is more effective to use p-maps as secondary layers, rather than attempting fully automated p-map reconstructions that typically require time-consuming post-hoc corrections
Creating Secondary layers
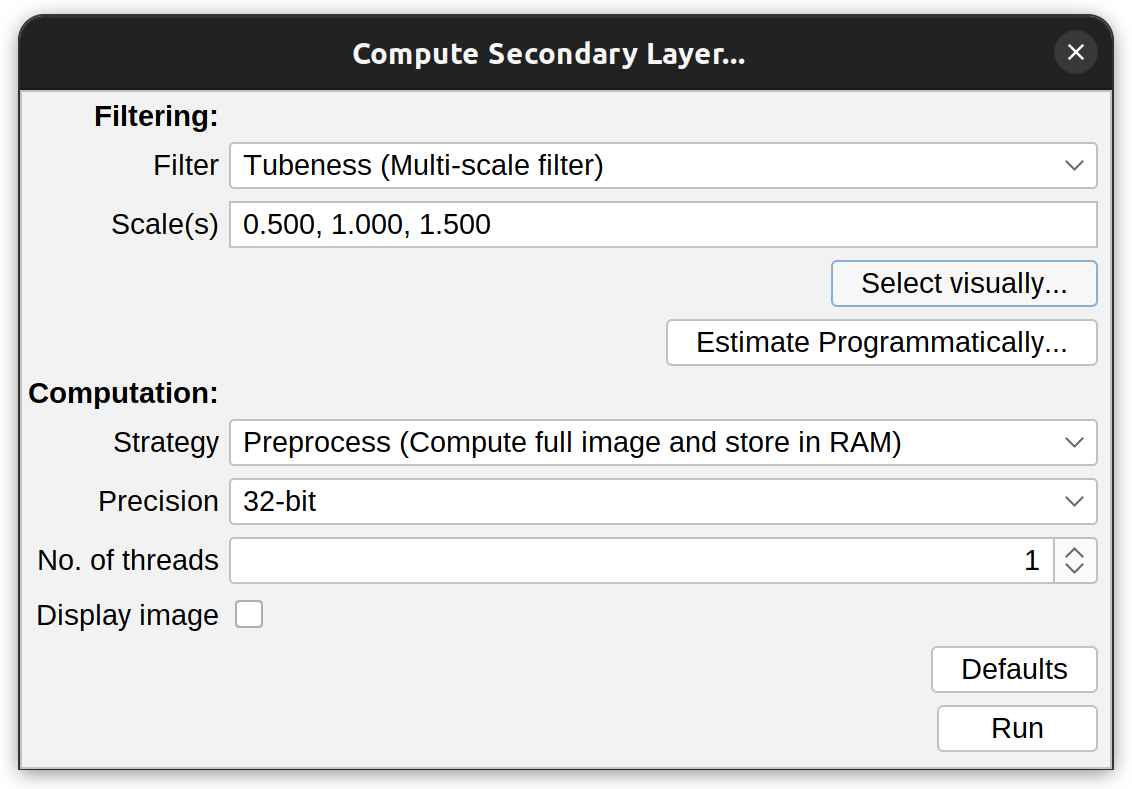
Secondary layers are created/load using the “Layers” drop-down menu in the auto-tracing panel. The most common way to create a new layer is by calling the Secondary Layer Creation Wizard:
The wizard needs two types of information from the user: The type of filtering operation and the size(s) (scale(s)) of the structures being traced, which control the spatial scale of the filter (known as σ).
-
Filter The filtering operation, including Tubeness, Frangi, Gaussian blur and Median:
-
Tubeness This corresponds to the Hessian-based analysis of older SNT versions. This filter enhances tube-like structures in the image, using an improved Tubeness approach, modified to support multiple scale(s)
-
Frangi vesselness A proven and consistent strategy for filtering tube-like structures. Described in Frangi
-
Gaussian blur Filter for noise removal, capable of gentle smoothing with some ability to preserve neurite edges, specially under small σ values.
-
Median Filter for noise removal able to preserve neurite edges. Note that Median accepts only one σ value, i.e., a single scale.
-
-
Scale(s) Also known as sigma(s) (σ). These should reflect average radii of the structures being traced. If smaller values are specified, the filter becomes more sensitive to noise. Larger values on the other hand, make the filtering operation less sensitive to local shape characteristics. There are two ways to select this values:
-
Select visually…: The wizard will prompt you to click on a representative region of the image which has a meaningful structure. Once you click there, a preview palette is generated showing increasing values of σ (from top-left to bottom-right) applied to that region of the image. Select the suitable scales
-
Estimate programmatically…: This allows automated estimation of radii across the image, which can inform the choice of scale(s). The only parameter required is Dimmest intensity (approx.): Pixel values below this value are treated as background when computing thicknesses. Use -1 to adopt the default cutoff value (half of the image max). After pressing OK, a color-mapped image (based off local radius) and a histogram showing the distribution of radii across the image are shown. The histogram can be used to validate values chosen visually in the preview palette.
NB: Analysis is performed via the Local Thickness (complete process) plugin (Analyze › Local Thickness › Local Thickness (complete process) in Fiji’s menu bar).
-
NB: The wizard also allows you to use a backup copy of the image being traced as secondary layer. This is only useful if you intend to modify the original image during a tracing session, but want to have convenient access to the initial image at a later time.
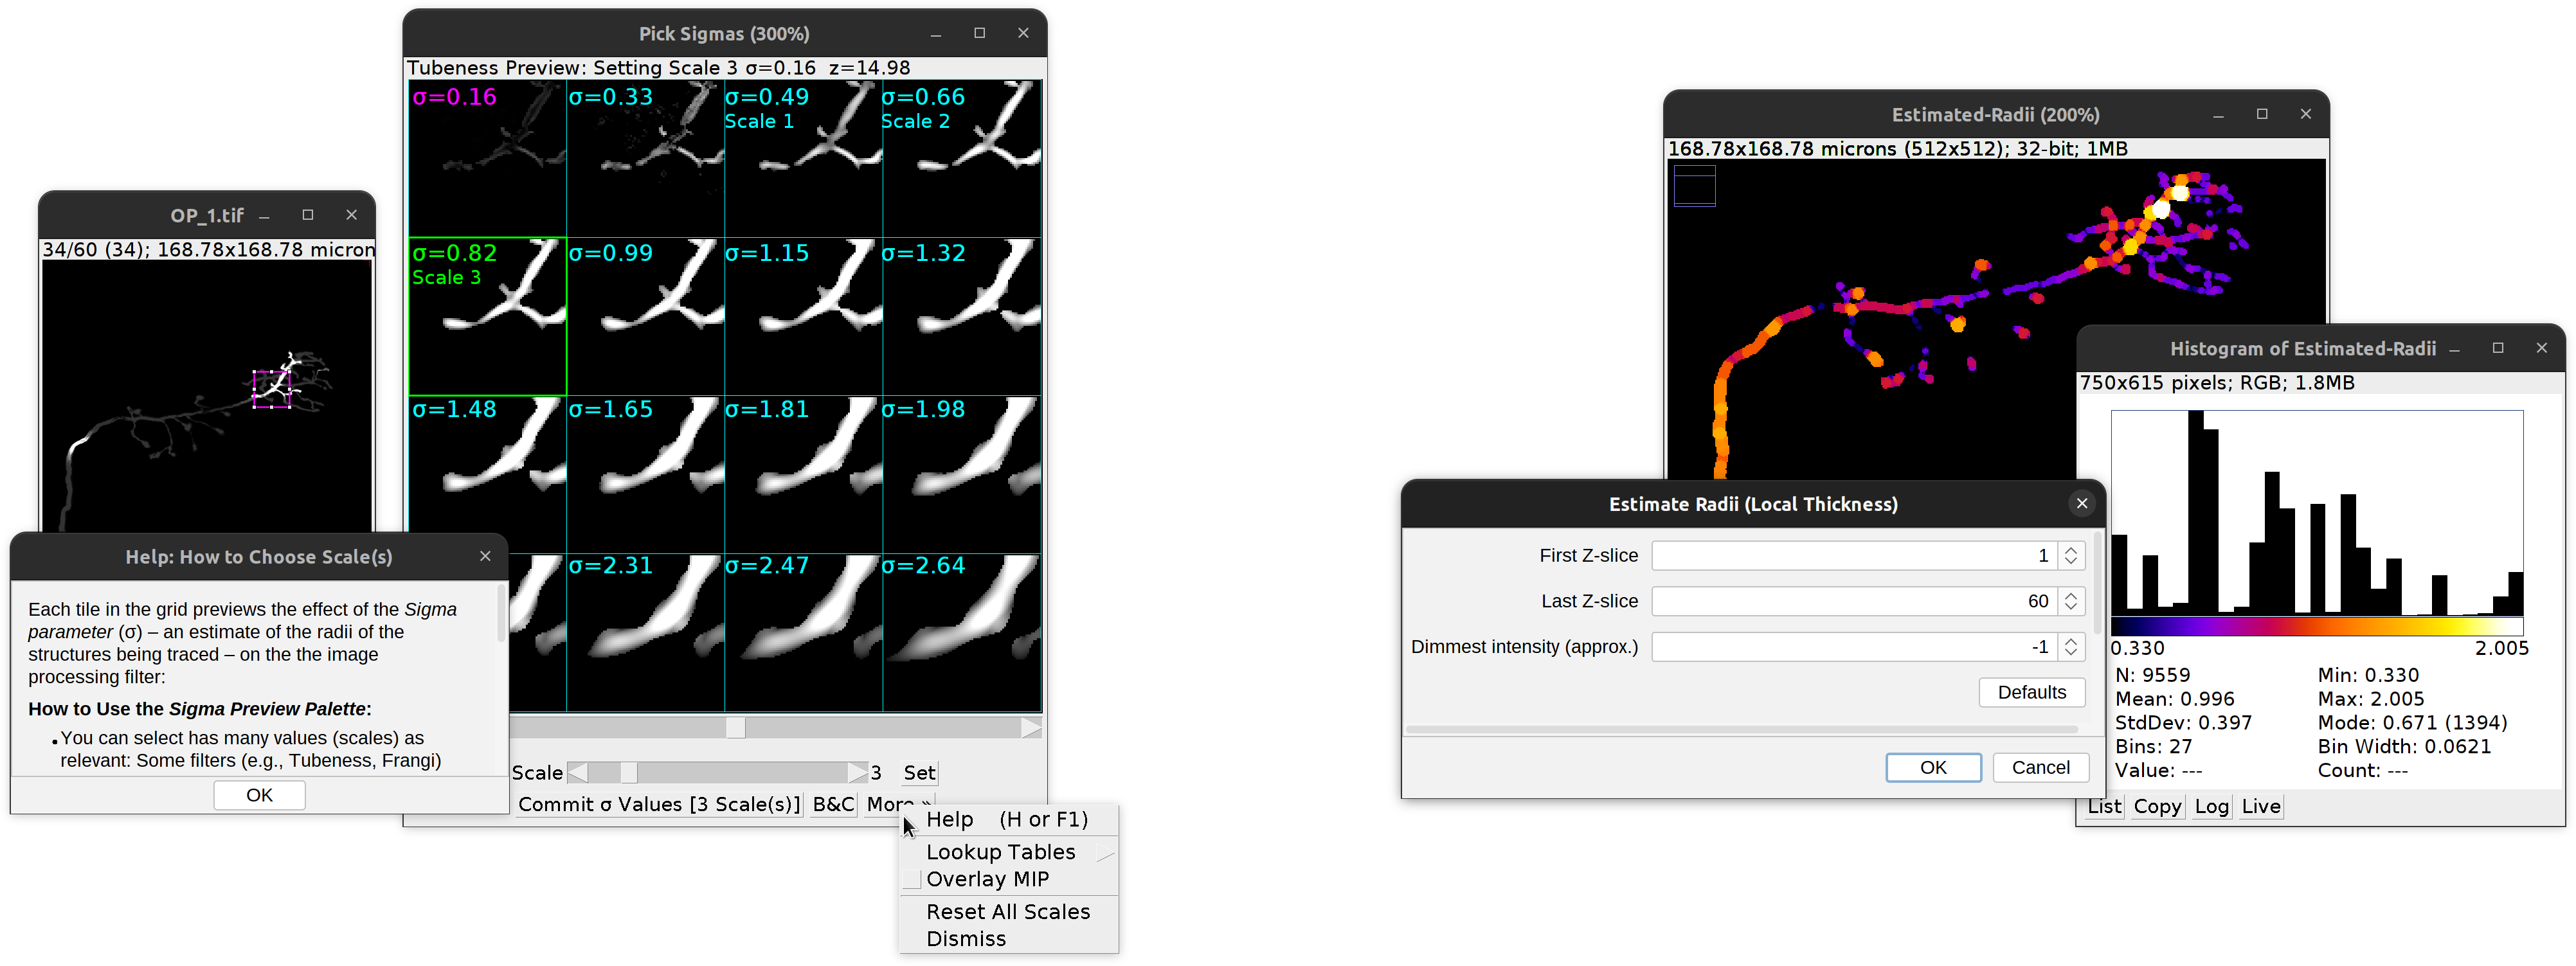
Secondary Layer Wizard.
Left: Visual selection of filtering kernel(s) using the Sigma palette. The palette features its own offline manual accessible by pressing H or F1. Right: Programmatic estimation of radii across the whole image using local thickness.
Loading Secondary layers
The “Layers” drop-down menu in the auto-tracing panel also allows for importing secondary images processed elsewhere: Either from a file or an image already open in Fiji. See the Generating Filtered Images walkthrough for more details.
The same menu also provides options to import a Labkit/Weka model. In this case the model is applied to the image being traced, and the resulting ‘p-map’ is loaded as secondary layer.
Computation Settings
This widget reports current settings (cost function, image statistics, etc.). Report can be copied to the clipboard, or logged to the Script Recorder.
Filters for Visibility of Paths
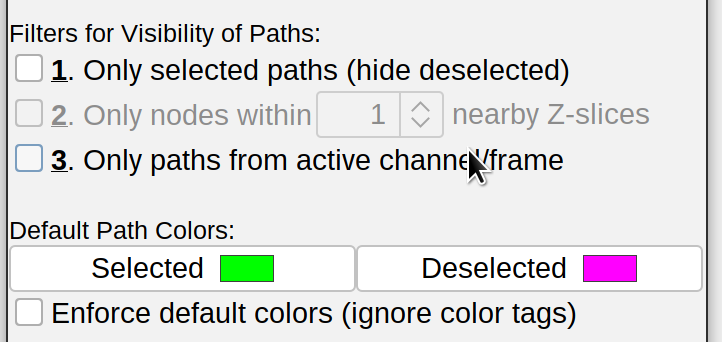 By default, all the nodes of a path are projected onto the current Z-slice. This is useful to see how much has been completed and gives a sense of the overall structure of the reconstruction. However, SNT provides three additional visibility options for paths:
-
Only selected paths (hide deselected) Only show paths that have been manually selected in the Path Manager or with the G key (⇧ Shift + G to select multiple paths).
-
Only nodes within {x} nearby Z-slices Only highlight nodes within {x} number of Z-slices on either side of the current slice. The projected skeletons of all paths remain visible.
-
Only paths from active channel/frame If tracing on a multichannel image or an image with a time axis, only show paths from the active channel or frame.
Any combination of these options may be toggled simultaneously. Note that these options do not apply to Rec. Viewer and sciview.
Default Path Colors
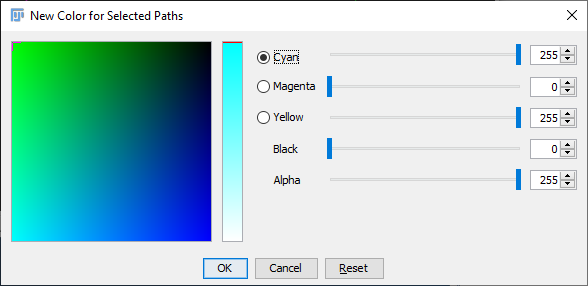 By default, finished paths are colored by their selection status (only selected paths can be edited, or extended). The default colors are Green (selected paths) and Magenta (deselected). Default colors can be customized by pressing the respective button in the widget . For customizing unconfirmed and temporary paths, see the Colors option in the UI Interaction widget.
Enforce default colors (ignore color tags) If active, SNT will force all paths to conform to the default “Selected” and “Deselected” color buttons. Any custom color tags will be ignored until the option is toggled off. Note that this options does not apply to Rec. Viewer and sciview.
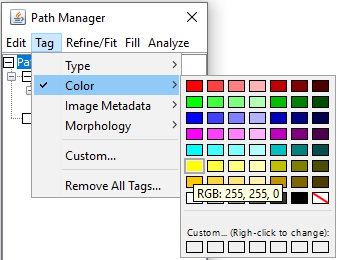
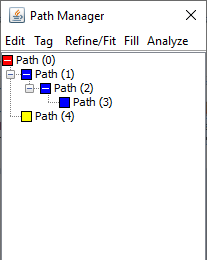
The Path Manager offers several ways to colorize Paths:
- Using Tag › Color swatches (custom colors can be temporarily assigned to empty swatches, by right-clicking on them)
- Using Analyze › Color Mapping…, providing morphometric-based color mapping.
Options Tab
This tab aggregated widgets for advanced settings.
Views
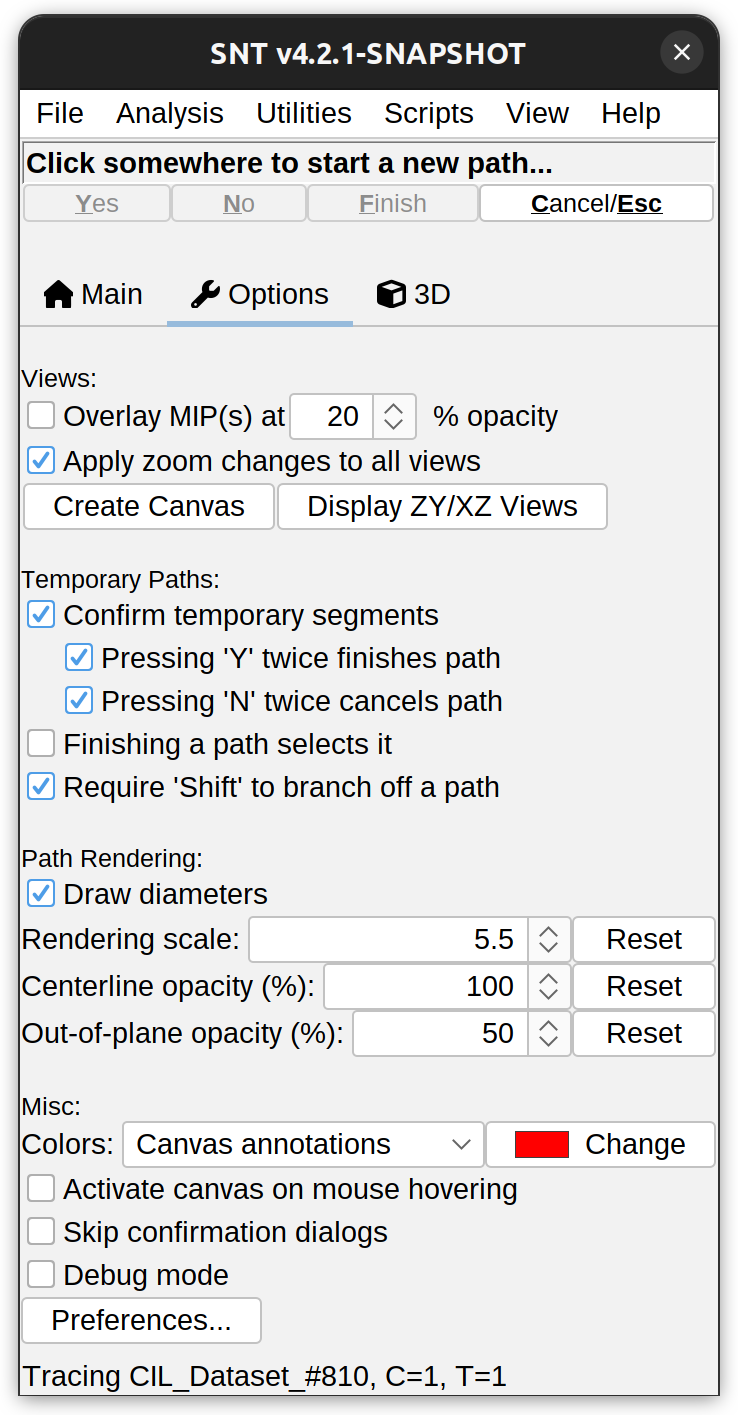
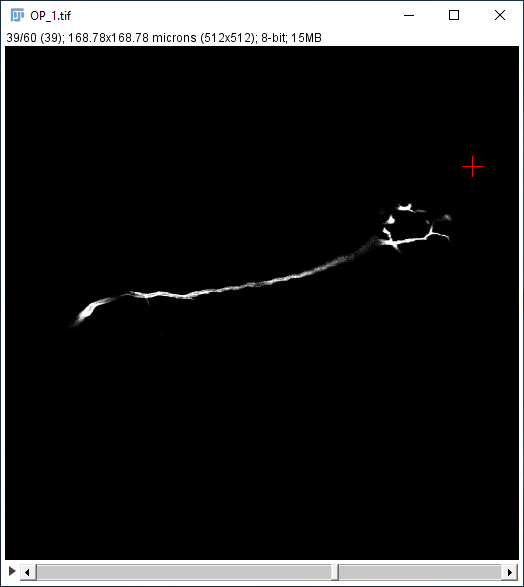
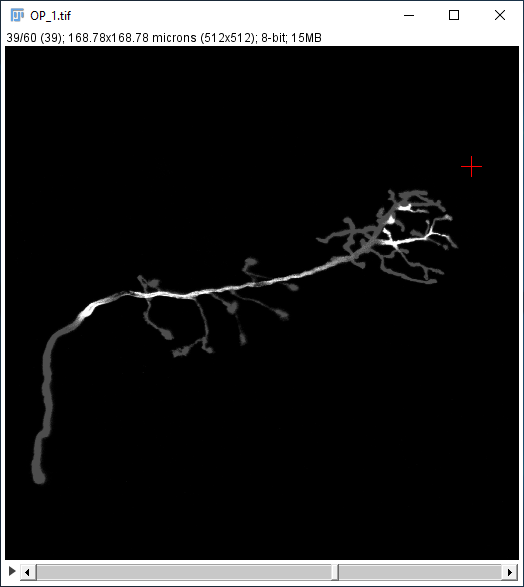
- Overlay MIP(s) at X% opacity Overlays the Maximum intensity projection of the image “over” the image canvas at the specified opacity. The overlaid projection is only used as a visualization aid and is ignored by the auto-tracing algorithms. It is rendered using the LUT of the channel currently being traced. To reload the overlay (e.g., in case the image being traced changes during a tracing session) toggle the checkbox twice.
-
Apply zoom changes to all views If a zoom change is applied to any one of the XY, ZY or XZ views, apply the same change to the two other views if they are open. Since in ImageJ zooming may resize the image window, you can use Views › Arrange Views to reset their positions
-
Invert LUT Convenience shortcut for inverting the LUT of tracing image. If using a display canvas, the button toggles between a white, gray, or black backgrounds
-
Create/Resize Canvas If using a display canvas to view reconstructions, reset its dimensions to the default. If the tracing image has been closed, it creates a display canvas for current paths. Note that this command does not resize the actual image being traced. To do so, use ImageJ’s command Image › Adjust › Canvas Size…
-
Display ZY/XZ views If currently using the XY only view, display the ZY and XZ views as well.
Temporary Paths
-
Confirm temporary segments If active, prompts for either confirmation or denial of whether to keep an unconfirmed path segment. If inactive, automatically confirms the path segment created on each subsequent node placement after starting a path. Applies to both auto-traced and manually traced path segments. The following two settings are only toggle-able when this setting is active:
- Pressing ‘Y’ twice finishes path Finish a temporary path on two successive Y key presses.
- Pressing ‘N’ twice cancels path Discard a temporary or unconfirmed path, including the start node, on two successive N key presses.
-
Finishing a path selects it Whether a path should be automatically selected once finished.
-
Require ‘Shift’ to branch off a path If selected the default shortcut for branching off a path ( ⌥ Alt +
Left Click ) becomes ⇧ Shift + ⌥ Alt +
Left Click, which avoids conflict with OS-level shortcuts (in several Linux distributions, ⌥ Alt +
Left Click is a common shortcut for dragging windows around the screen).
Path Rendering
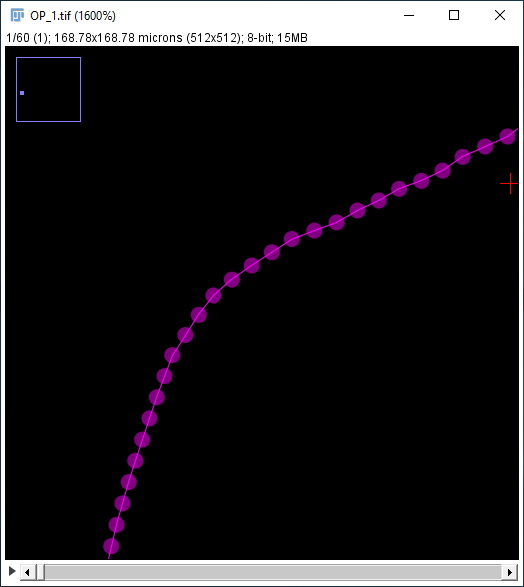
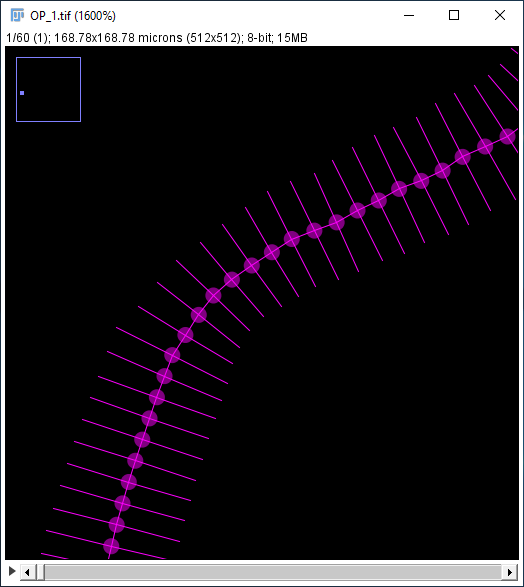
- Draw diameters Displays the stored diameter (if any) in the XY view for all existing nodes. Each diameter is drawn as a line segment with length = diameter, which is bisected by the orthogonal tangent vector to the path at that node.
-
Rendering scale Adjusts the radius of the drawn circles representing path nodes. A path node is rendered as a circle centered at the XYZ coordinate of the point annotation. The default scale is inferred from the current zoom level.
-
Centerline opacity (%) The render opacity (in percentage) for node diameters and segments connecting path nodes.
-
Out-of-plane opacity (%) The render opacity (in percentage) for path segments that are above/below the active Z-plane. It is only considered when tracing 3D images and visibility filters are set to Only nodes within {x} nearby Z-slices.
Misc
- Colors Specifies how components should be rendered, including:
- Canvas annotations The label shown in the top-left corner of the views indicating the state of the UI (“Tracing Paused”, “Choosing Sigma”, etc.)
- Fills The pixels that have been reached by the Fill search
- Unconfirmed and Temporary paths.
-
Activate canvas on mouse hovering If active, moving the mouse cursor over any of the views automatically brings the view window into focus, allowing it to receive input.
-
Skip confirmation dialogs If active, disables the “Are you sure?” prompt preceding major actions. Note that this option does not apply to irreversible actions such as deleting paths.
-
Debug mode If active, logs detailed information about actions in the console.
- Preferences… Allows setting other options, namely:
- Whether the position of dialogs should be remembered across restarts
- Whether Gzip compression (lossless) should be used to reduce the storage footprint of “.traces” files.
- The max number of parallel threads to be used by SNT, as specified in ImageJ’s Edit › Options › Memory & Threads…
- Reset All Preferences… Resets all options to their default values. A restart of SNT may be required for changes to take effect.
3D Tab
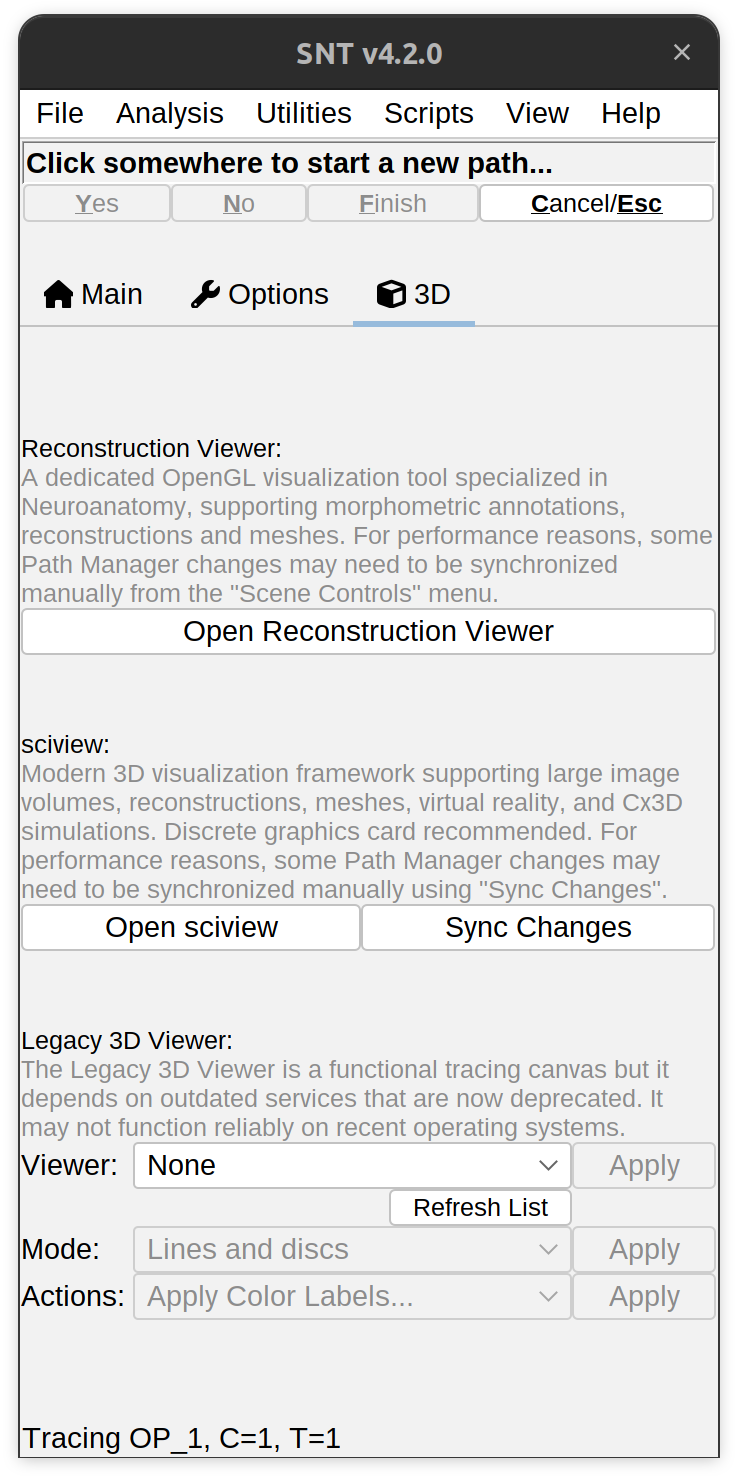 This tab aggregates widgets related to 3D interaction.
Reconstruction Viewer
This widget provides an entry point to a dedicated Reconstruction Viewer that loads all the paths currently listed in the Path Manager. Note that the behavior of this dedicated viewer is slightly different from standalone viewers:
-
Paths are aggregated under a common “Path Manager Contents” object
-
Changes to paths performed in the Path Manager should percolate in real time to the viewer. However, some operations may require manual synchronization using Sync Path Manager Changes in the Scene Controls menu
-
Initializing a viewer from this widget will always load the current contents of the Path Manager. To start a viewer with an empty scene, press Reconstruction Viewer on the Neuroanatomy Shortcuts Window dialog
sciview
This option assumes sciview to be successfully installed. sciview is a modern replacement for the Legacy 3D Viewer, providing sophisticated 3D visualization and virtual reality capabilities for arbitrarily large image volumes and meshes. sciview scenes support image volumes, meshes, and paths, as well as integration with Cx3D. The latter enables simulation of neurodevelopmental processes, including neuronal growth and formation of cortical circuits. See SNT: Modeling for details.
Big Volume Viewer
Big Volume Viewer (BVV) is the 3D counterpart of BigDataViewer capable of GPU volume rendering of images too large to fit into memory. Currently, support for Big Volume Viewer remains highly experimental.
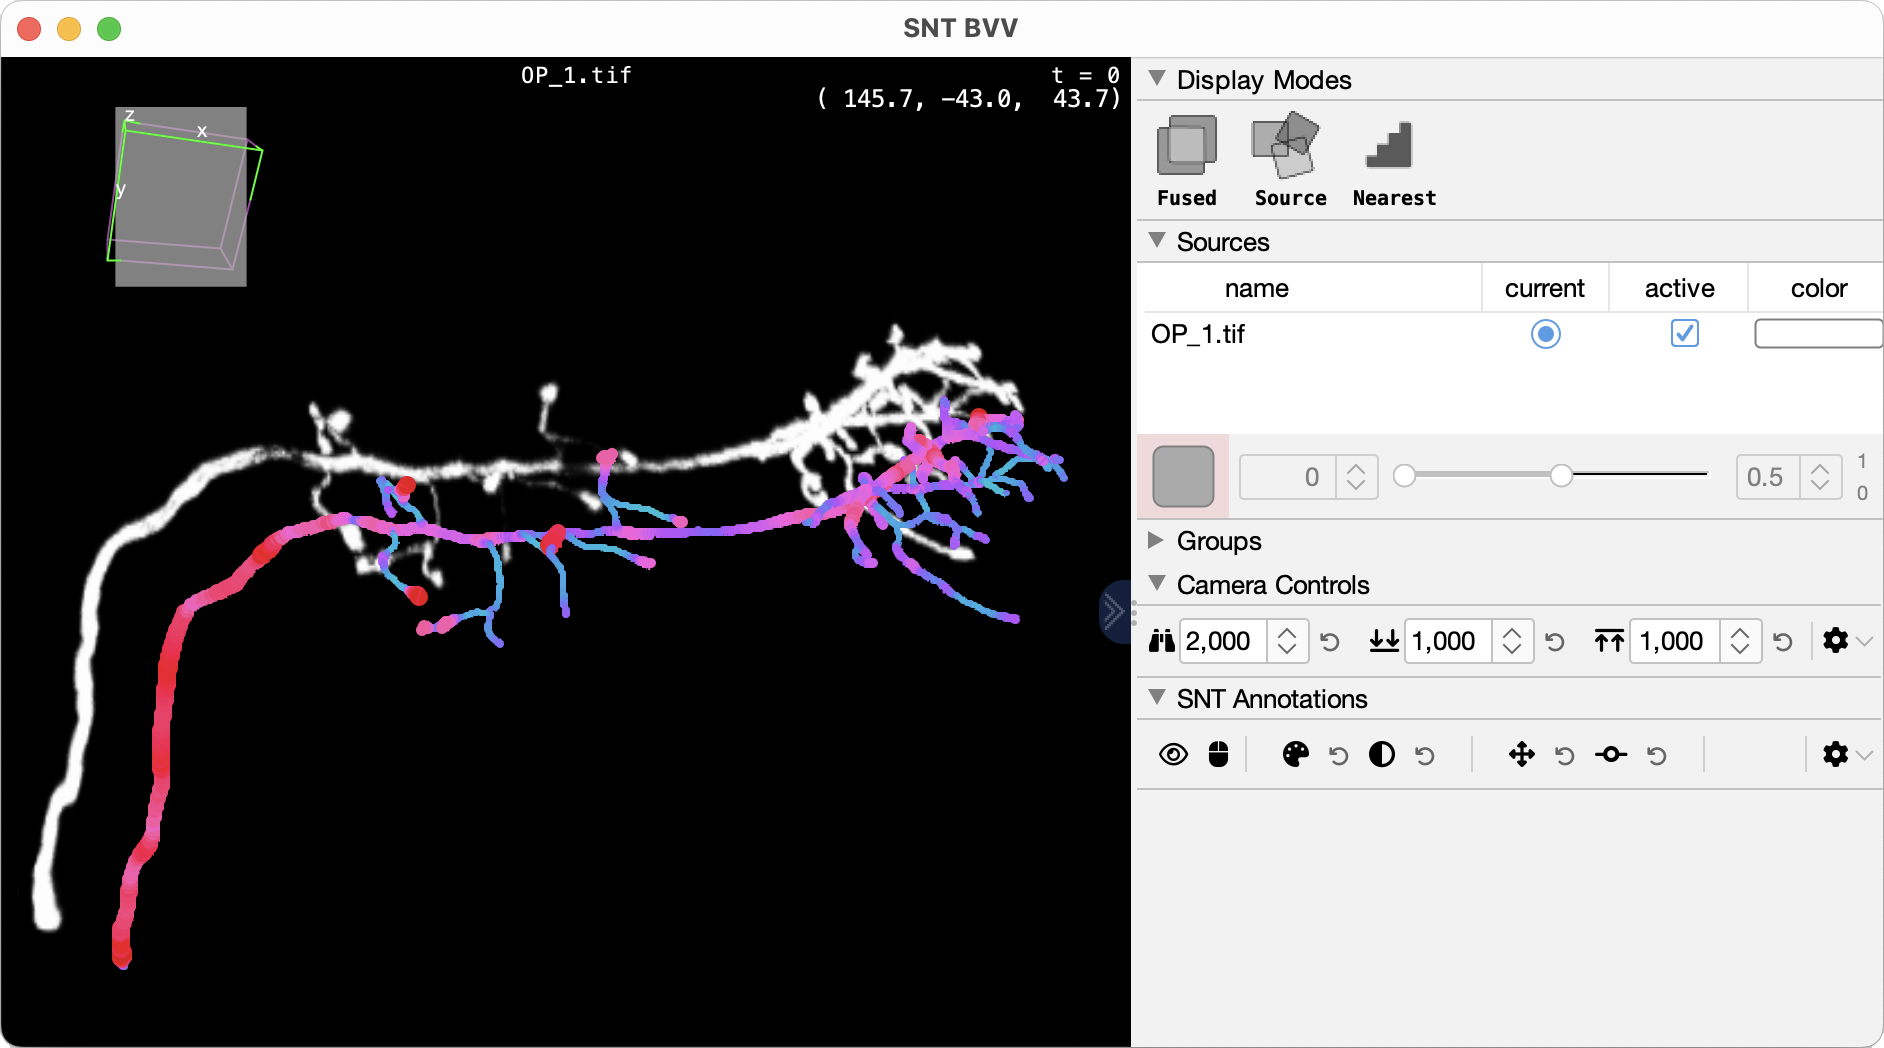
BVV integration
Legacy 3D Viewer
The Legacy 3D Viewer is a functional tracing canvas and allows images to be traced interactively in 3D. However, it relies on libraries that are not actively maintained and may not function reliably during complex tasks. That being said, SNTv5 has implemented several improvements that have restored/improved Legacy 3D Viewer functionality relatively to earlier versions. For usage instructions, see Tracing using the Legacy 3D Viewer.
Bookmarks Tab
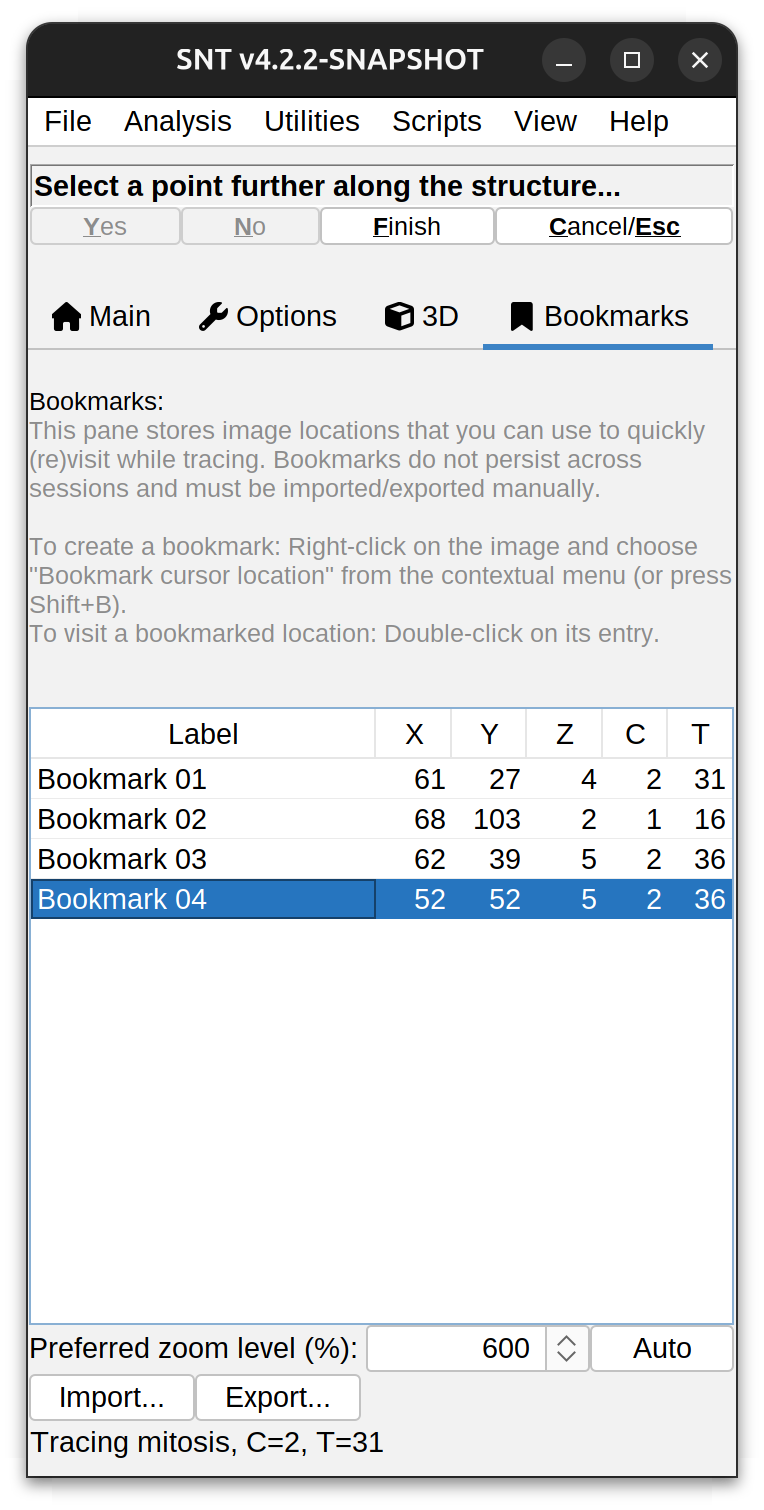
This tab hosts the Bookmark Manager, a utility that stores image locations to be (re)visited during tracing (e.g., a location of an ambiguous branching point or an ambiguous cross-over between two neurites). Bookmarked locations can also be used as spine/varicosity markers. The basic usage is as follows:
-
Right-click on the image and choose Bookmark Cursor Position from the image contextual menu (shortcut: ⇧ Shift + B). A new bookmark will be added logging the cursor’s X, Y, Z, C, T coordinates
-
To visit a bookmarked location, double-click on its entry. The image will be centered at that position under the specified zoom in Preferred Zoom Level (%)
-
To rename an existing bookmark, select it and start typing its new label. Alternatively, use Rename Selected Bookmark.. command in the list right-click menu
-
Use the Import button to load bookmarks from either: 1) a CSV file, 2) Existing ROIs in ImageJ’s ROI Manager, or 3) Existing ROIs in the overlay of the image being traced. Note that when loading an area ROI, the bookmark is registered at the ROI’s centroid
-
Use the Export button to save the current list to either: 1) a CSV file, 2) ImageJ’s ROI Manager or 3) the overlay of the active image. Note that when images are saved as TIFF, ROIs are saved in the file’s header, and automatically loaded by ImageJ when the image is open.
Delineations Tab
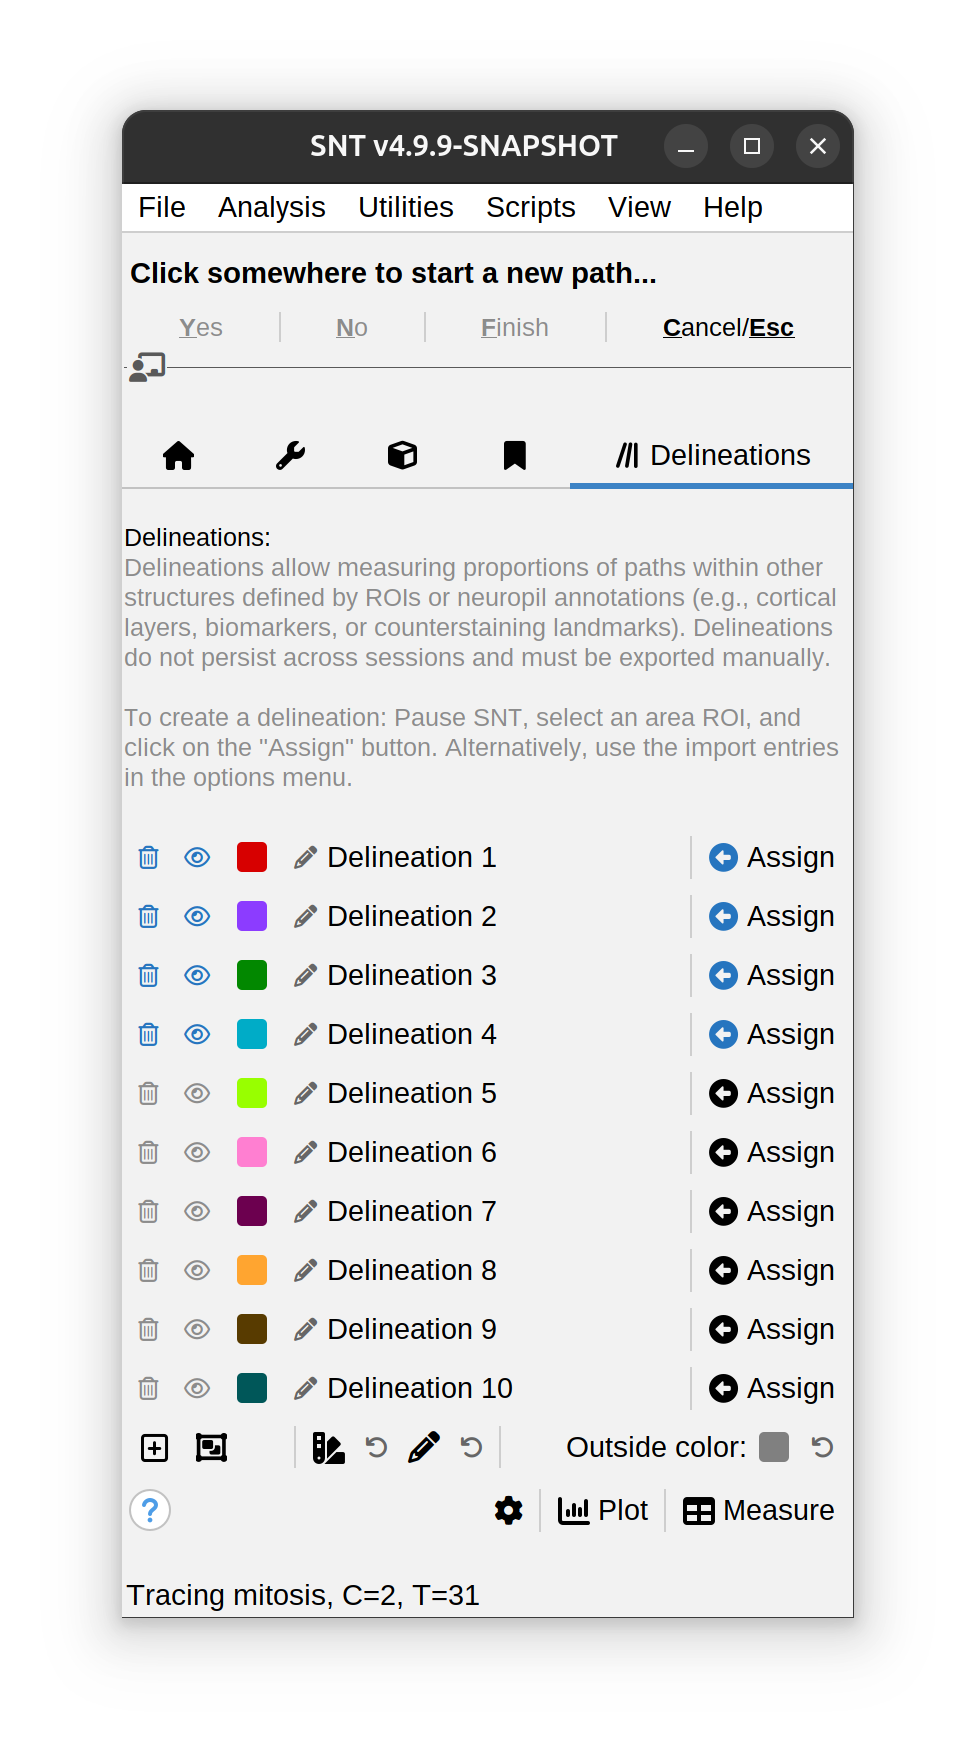
This tab hosts the Delineations Manager, a utility that allows measuring proportions of paths within other structures defined by ROIs or neuropil annotations (e.g., cortical layers, biomarkers, or counterstaining landmarks). Delineation analyses are described in detail in Walkthroughs › Delineation Analysis.
Notes Tab
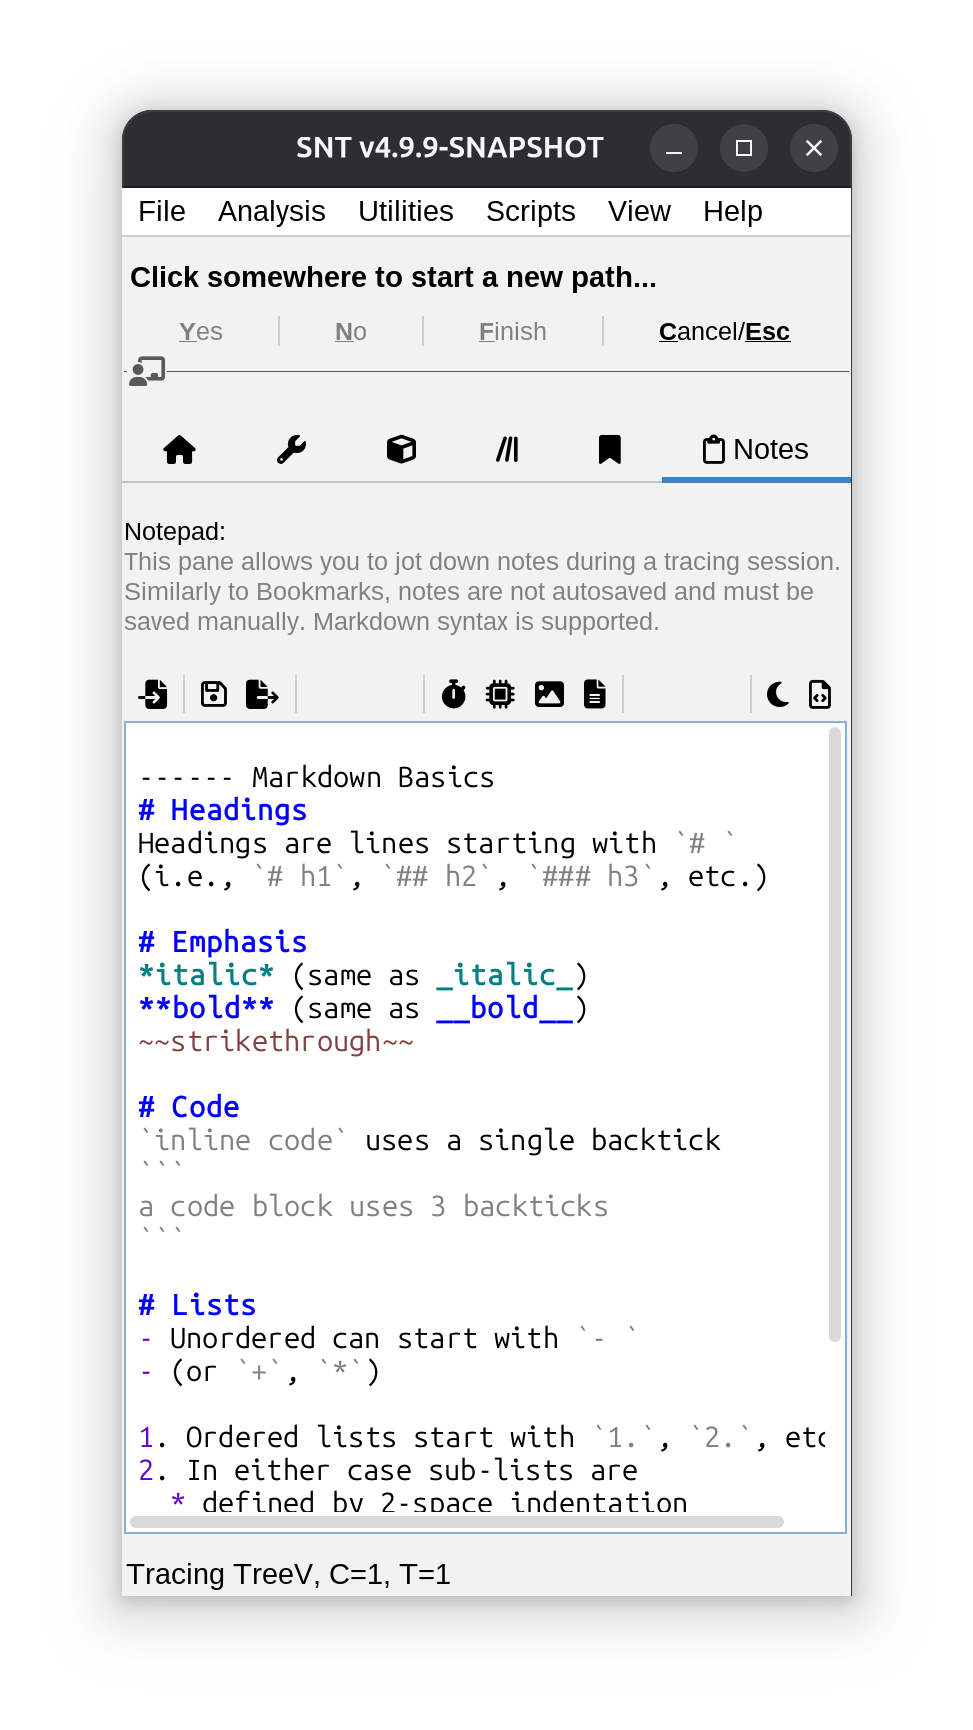
This tab hosts a simple notepad allowing you to jot down notes without disrupting the tracing workflow. Notes are not stored in neither .TRACES nor .SWC files and must be saved manually. The notepad is rather simple but supports markdown markup, and features a dedicated toolbar for insertion of automated text, such as name and path of image being traced, current time, computation settings, etc.
Status Bar
The status bar at the bottom of the Main Dialog displays brief messages about ongoing operations. By default, the status bar reports the image title and the CT position being traced.
Image Contextual Menu
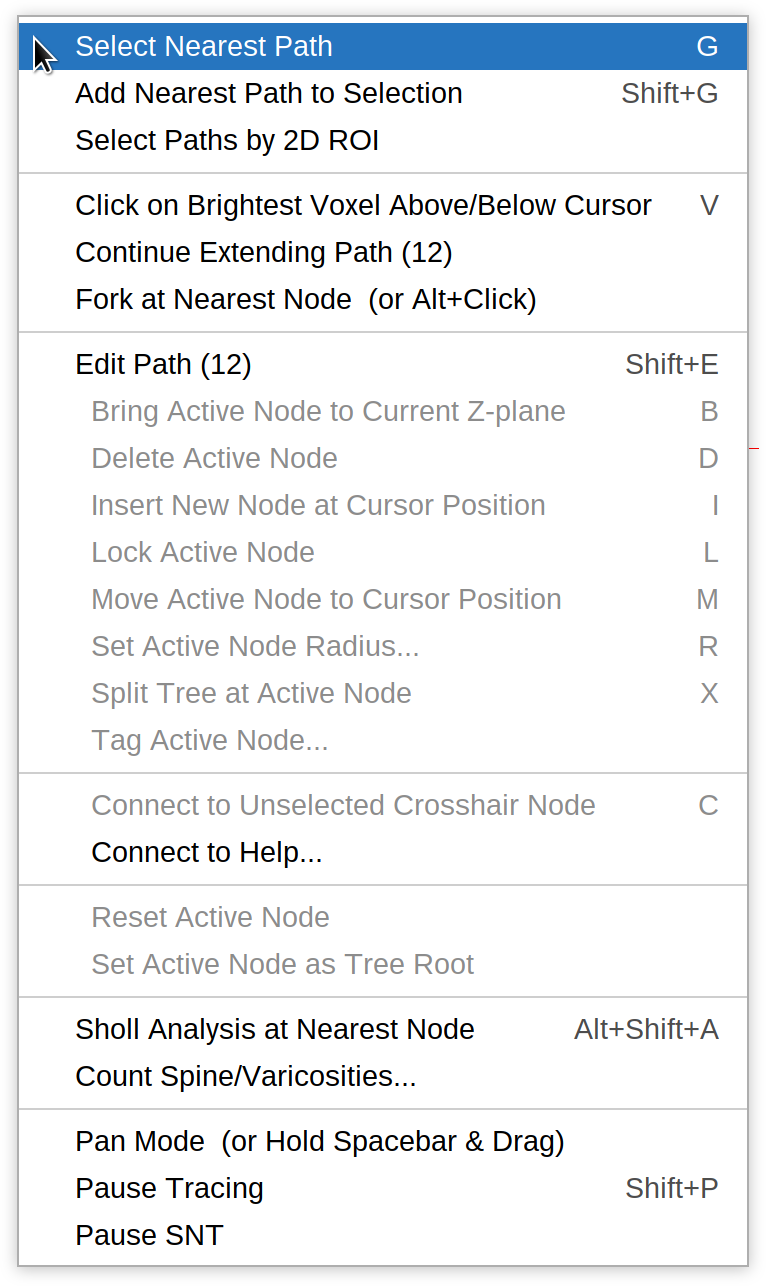
Right-clicking on any of the tracing views will bring up a menu with various editing tools. The corresponding keyboard shortcuts are shown to the right of each option. The list includes:
Path Selection
Select Nearest Path G
Selects (“Groups”) the path closest to the mouse cursor.
Add Nearest Path to Selection ⇧ Shift + G
Keeps appending the closest path to the existing path selection.
Select Paths by 2D ROI
A convenience utility to select path(s) quickly (but coarsely). One the command is run, it is possible to “draw” an area ROI around the paths of interest, so that path(s) intersecting ROI boundaries can be selected. The shape of the ROI (rectangle, oval, freehand, etc.) is determined by the area ROI tool currently selected in ImageJ’s main toolbar
Bookmark Cursor Position ⇧ Shift + B
Described in Bookmarks Tab.
Tracing
Click on Brightest Voxel Above/Below Cursor V
Finds the brightest Voxel above and below the current x,y position and automatically clicks on it. If multiple maxima exist, their average positioning is used. Note that this feature assumes that neurites are brighter than the background.
Continue Extending Path
Allows continued tracing of previously finished paths. Note only one path may be extended at a time. To extend a path: first select it, choose this option, then place additional nodes as shown in Step-By-Step Instructions.
Fork at Nearest Node ⌥ Alt +  Left Click
Creates a fork point at the node closest to the mouse cursor. Once a fork point is made, the branch may be extended as described in Step-By-Step Instructions. Note that the shortcut can be set to ⇧ Shift + ⌥ Alt + Left Click in the Options tab.
Editing Paths
Pressing Edit Path with a single path selected will activate Edit Mode, unlocking the menu options under Edit Path. When Edit Mode is active, moving the mouse cursor along the path will highlight the nearest node with a crosshair icon and synchronize the current Z-slice to the location of that node. Note that the ability to create new paths is temporarily disabled when in Edit Mode.
Bring Active Node to Current Z-plane B
Moves the active node to the active Z-plane. Note that the translation is only done in Z. XY positions are unchanged.
Connect To (…) C
Allows two existing paths to be connected, typically under a parent-child relationship. Described in this walkthrough.
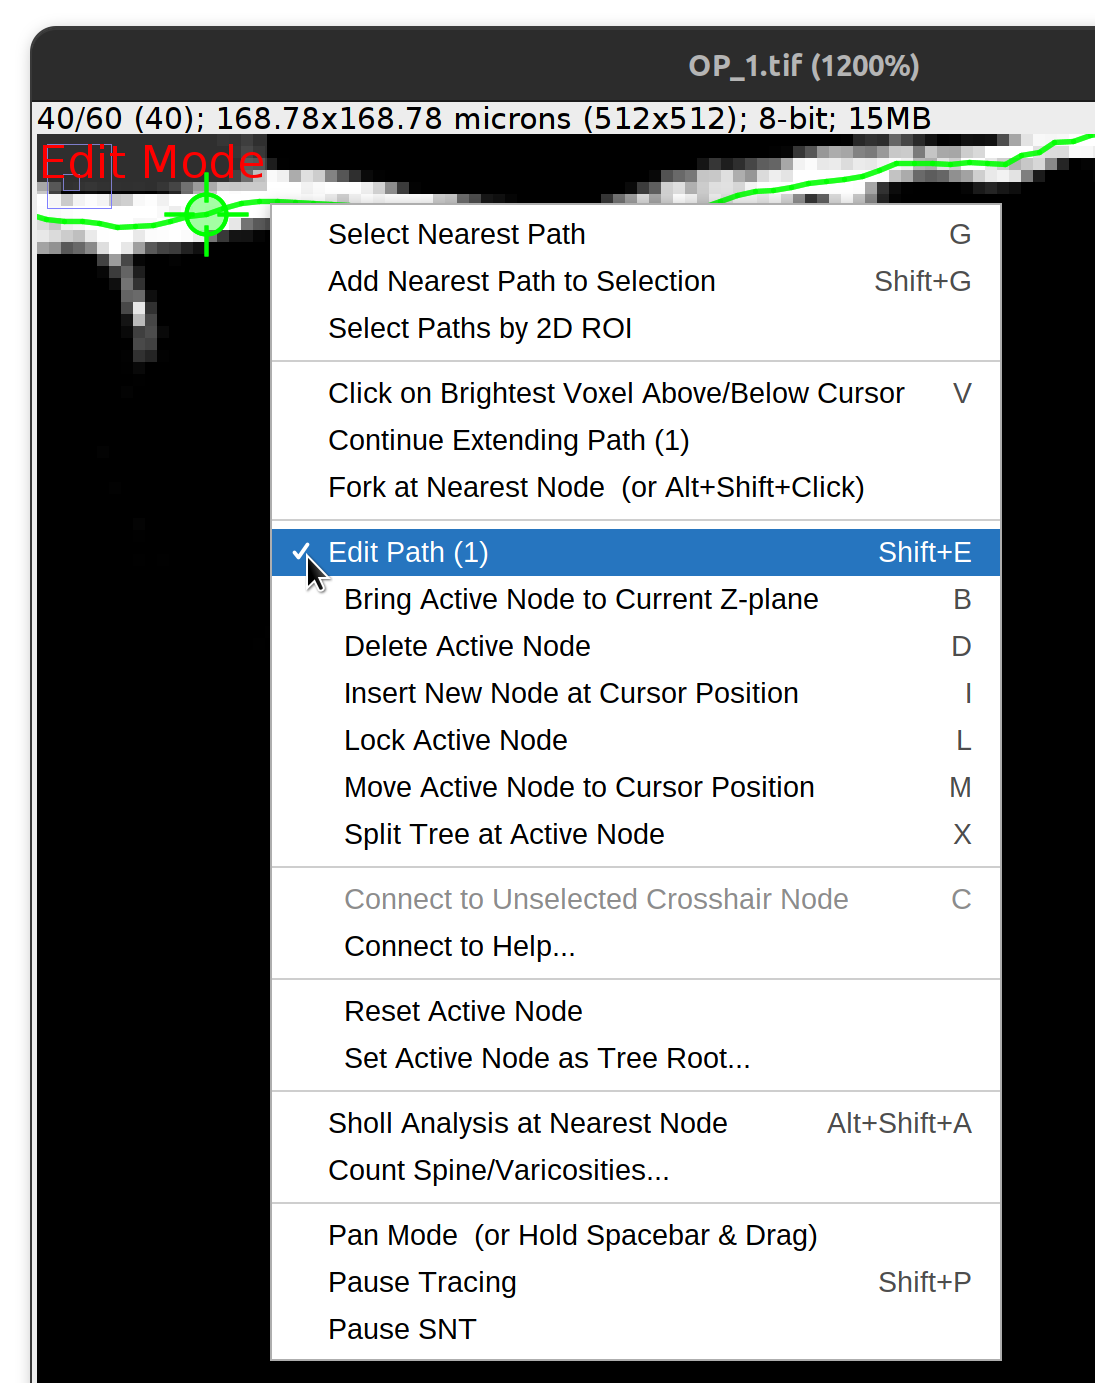
Delete Active Node D
Removes the active node from the path.
Insert New Node At Cursor Position I
Inserts a new node at the cursor position. The inserted node is placed between the active node and its parent.
Lock Active Node L
Ensures the active node won’t change on cursor movement. Useful for e.g., ensuring that a merge operation is not affected by accidental cursor movement.
Move Active Node to Cursor Position M
Moves the active node to the cursor location.
Set Active Node Radius… R
Allows radius of active node to be modified. Options include: 1) Assign a specific value or a scaling factor; 2) half of the minimum voxel size; 3) The average radius of flanking nodes; or 4) the average path radius.
Split Tree at Active Node X
Splits the current tree into two subtrees by disconnecting the active node from its parent structure
Reset Active Node
Clears/Deselects the active node.
Set Active Node as Tree Root
Reorganizes the existing tree so that the active node becomes its root.
Tag Active Node…
Assigns a color tag to the active node. Note paths with color-coded nodes may be rendered differently from default paths in terms of opacity, rendering scale, etc.
Actions
Count Spines/Varicosities
Described in Spine/Varicosity Analysis.
Sholl Analysis at Nearest Node ⇧ Shift + ⌥ Alt + A
Described in Analysis › Sholl Analysis (by Focal Point).
Pause Tracing ⇧ Shift + P
Disables tracing functions until this option is deselected. Tracing views are annotated with the Tracing Paused label to indicate this state.
Pause SNT
Waives all keyboard and mouse inputs to ImageJ, allowing you to interleave image processing routines with tracing operations. Note that if the image contents change while SNT is paused, the image should be reloaded so that SNT is aware of the changes. Tracing views are annotated with the SNT Paused label to indicate this state.
Path Manager
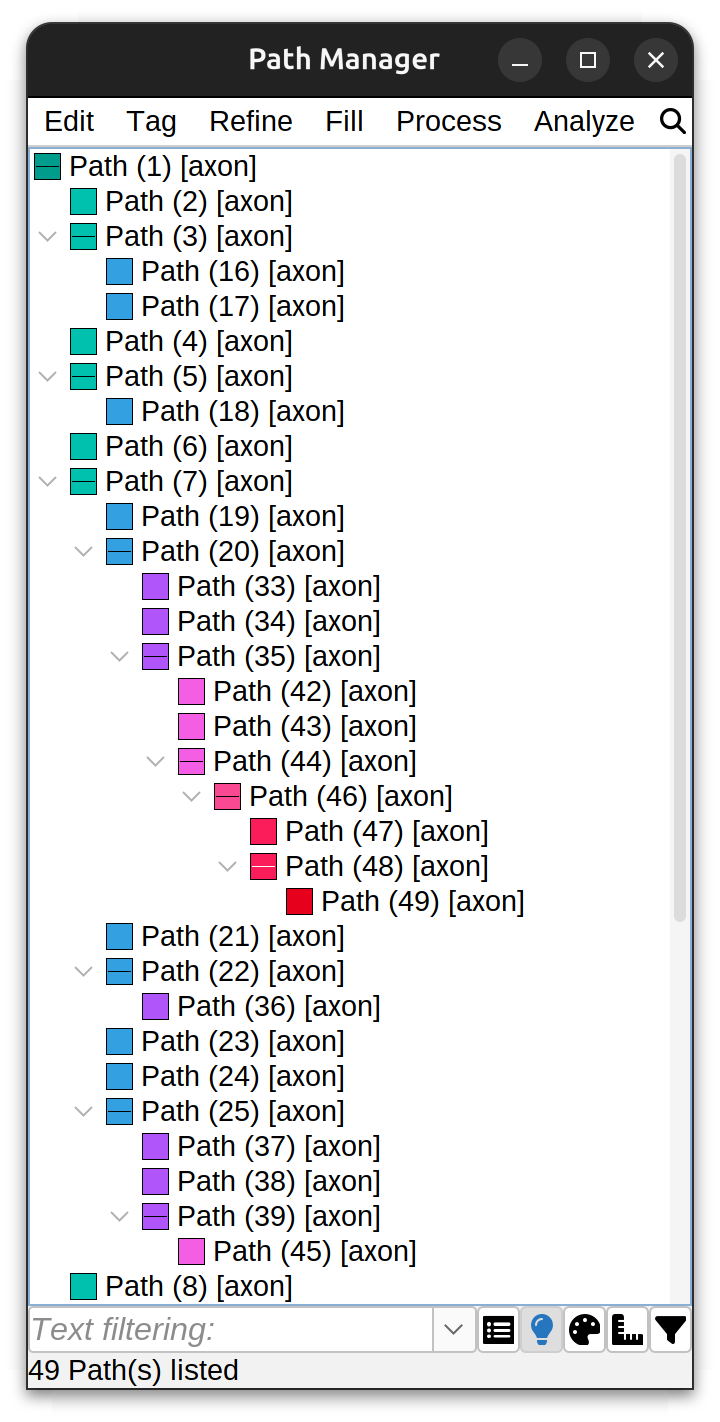 The Path Manager dialog displays all existing paths in a hierarchical structure, where one path is “primary” or “root” (path 1) and all other paths (paths 2…N) are children of the primary path. This pattern repeats for each structure (arbor) being traced. The dialog also contains several menus with various editing, tagging, refinement/fitting, filling and analysis options. Paths can be searched by name and/or tags in the text filter, with more sophisticated search capabilities in the Advanced Filtering Menu.
Path Manager commands are applied to all paths if no paths are selected.
Navigation Toolbar

The navigation toolbar allows for better handling of multiple arbors. An arbor is a primary (root‑level) path together with all of its children. In the Path Manager list, each arbor appears as a top‑level entry containing its dependent paths. The toolbar is designed to help you quickly navigate, filter, zoom, and bookmark image locations in larger projects. It includes the following controls:
Sort Arbors / Root‑level Structures
Reorders the arbors in the Path Manager using sorting options such as Arbor ID, Cell label, Traced channel, etc.
Arbor Chooser
This section of the toolbar allow for filtering the display of arbors in the Path Manager list. It includes the following controls:
-
Show All Arbors: Clears any filtering and shows all paths in the list
-
Drop‑down Choice: Allows you to ‘Jump to’ a specific arbor in the list. If Hide others (see below) is active, choosing an arbor limits the list to only that arbor’s paths
-
Next Arbor: Cycles the Arbor choice to the next entry
-
Hide Others: Shows only the arbor chosen in the drop‑down. If selected the Path Manager list is filtered to the select choice. If unselected all arbors are shown. Toolbar actions (Zoom, Bookmark, see below) honor this filter.
Zoom to Selected Path(s)
Centers and zooms the image view to encompass the selected paths
Zoom to Selected Node(s)
Navigates to specific node locations on the selected paths, such as their midpoint, first/last branch point, etc. When a single path is selected, it is also possible to navigate to its node with the smallest/largest radius
Bookmark Menu
This menu creates bookmarks at important locations. Two types of bookmarks are possible: 1) Topological locations (branch points, end-points, etc.), and 2) Quality-Control (QC) locations. The latter are locations pertinent to inspection, and review of traced paths, and include:
- Manually Tagged Nodes: Nodes you previously color‑tagged (e.g., via the tracing canvas)
- Nodes With Invalid Radius: Nodes whose radius is unset or invalid
- Putative Crossovers: These are “apparent crossings” (two or more paths passing very near without being topologically connected), automatically detected by SNT’s algorithms. These are described in more detail in Walkthroughs. Note that detecting putative crossovers can be computationally heavy for large datasets. Start with a modest selection of paths and widen it as needed
Menu Commands
Edit ›
Delete…
Removes selected Path(s) from the Path Manager. Note that children of selected paths are not deleted by default unless selected. To include them, choose Append Children To Selection from Path Manager’s contextual menu. Also, if no Paths are selected, all Paths are deleted.
Duplicate…
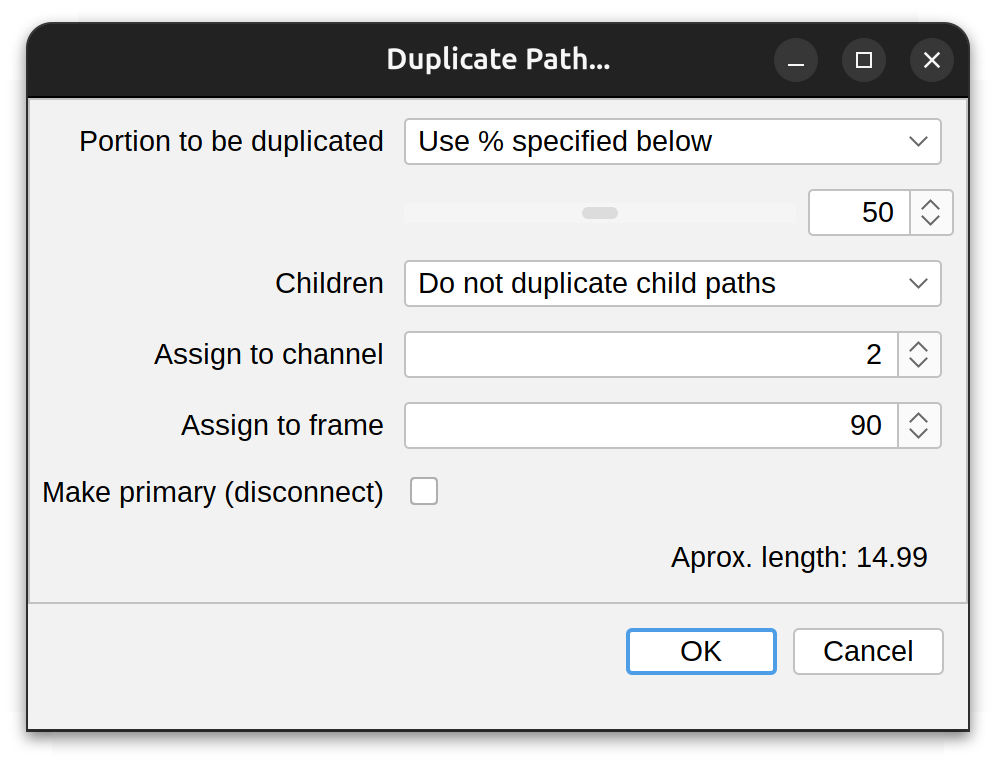
Duplicates the selected path with options to duplicate just a sub-segment or a full duplication with or without child paths. Options include:
-
Portion to be duplicated Either: Full length, Specified percentage of length, Up to first branch point, or Up to last branch point
-
Children Whether to include child paths in the duplication (either immediate or all children). Note that inclusion of children requires the path to be duplicated in full length
-
Assign to Channel/Frame The CT position of the duplicated path. Useful when ‘transferring’ paths across frames in timelapse videos
-
Make primary Whether the duplicated path (or group of paths) should be disconnected from their parent
Go To…
Zoom-in into specific locations of the selected path.
Rename…
Renames the selected Path. Only one Path may be renamed at a time because path names are expected to be unique.
Auto-connect…
Connects two paths in a parent-child relationship. The fork-point between the two will be automatically guessed.
Disconnect…
Disconnects selected path(s) from all of its connections. Note that this is an undoable operation and will force connectivity of remaining paths to be rearranged.
Combine…
Combines (connects) two or more disconnected paths into one (undoable operation).
Concatenate…
Concatenates two or more paths into a single un-branched segment. Concatenated paths must be oriented in the same direction. Can be used to merge non-contiguous fragments from full-automated tracing belonging to the same neurite.
Merge Primary Path(s) into Shared Root
Takes two or more primary paths and merges them into a common root node placed at the centroid defined by starting nodes of the primary paths to be merged. This is useful, e.g., when all the paths around a soma have been traced without passing through it. Note that this will alter parent-child relationships between paths.
Reverse…
Reverses the orientation of primary path(s) so that the starting node becomes the end-node and vice versa. Can be used to correct ‘anti-sense’ paths created by full-automated tracing.
Specify Constant Radius…
Assigns a constant radius to all the nodes of selected Path(s). This setting only applies to unfitted Paths and overrides any existing values.
Specify No. Spine\Varicosity Markers…
Assigns the no. of markers (e.g., spines or varicosities) to be associated to selected path(s) (see Spine/Varicosity Analysis).
Ramer-Douglas-Peuker Downsampling…
Simplifies paths by reducing their node density. Given an inputted maximum permitted distance between adjacent nodes, performs Ramer–Douglas–Peucker algorithm downsampling on the selected Path(s) (undoable operation).
Rebuild…
Resets all Path IDs and recompute connectivity for all paths. Useful to reset ill-relationships created from mis-editing paths.
Tag ›
Assigns tags to Paths. Tags allow for paths to be searched, selected, and bookmarked. Note that only SWC-type tags are preserved across restarts when saving traces in the SWC format. All others require data to be saved in SNT’s own .Traces format. Tags are organized in the following categories:
Type ›
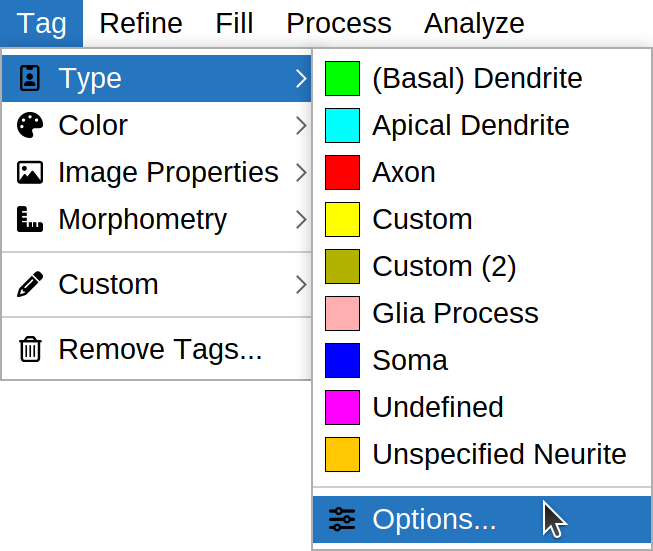 Type of neurite compartment (Axon, (Basal) Dendrite, Soma, etc.), as per SWC specification. It is also possible to pair each type with a color tag through the Options… dialog. These tags are considered to be essential annotations and are not eliminated by the Remove All Tags command. Paths are assigned the Undefined-type tag when created.
Color ›
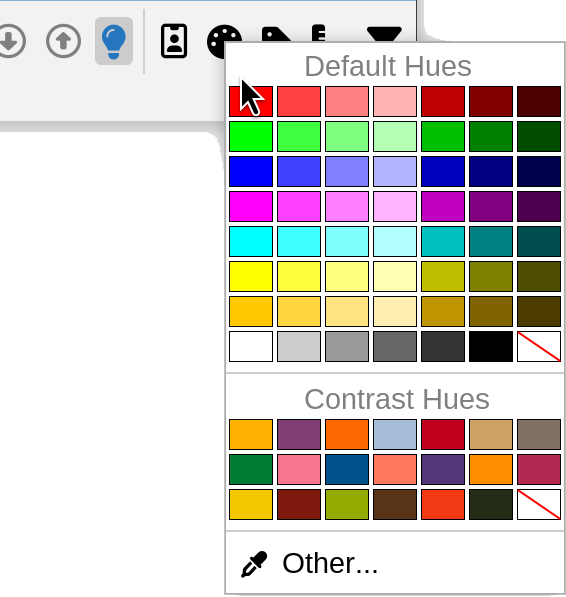
A preset swatch color, or a custom one chosen from the color chooser (right-click on a blank swatch). Note it is also possible to assign unique (distinctive) colors to a group of paths. Metric-based color mapping can also be applied using the Analyze › Color Mapping… command. Note that paths containing multiple colors (e.g., after node color mapping or after tagging individual nodes) are assigned a multicolor gradient icon in the Path Manager list.
Image Properties ›
Information on hyperstack position details (e.g., channel, frame or slice labels on which a path was traced).
Morphometry ›
Morphometric properties, such as Path length, Path mean radius or Path order.
Proofreading Toolbar
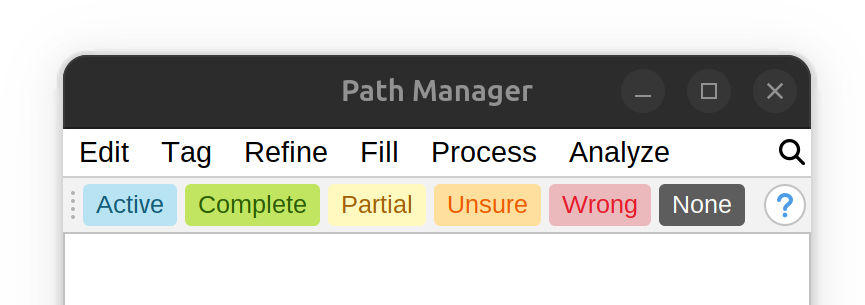
The proofreading toolbar allows for path-reviewing tags to be applied to selected paths in a convenient manner. Only one proofreading tag can be applied, because the previous assigned tag is replaced by the most recent assignment. Press “None” to remove existing tags, right-click on the toolbar and choose Change Colors… to edit tags. The toolbar also includes an option to summarize current tag assignments, by listing the proportions of tagged paths.
Other…
Ad-hoc tag(s) can be typed in a dialog prompt (comma-separated list supported).
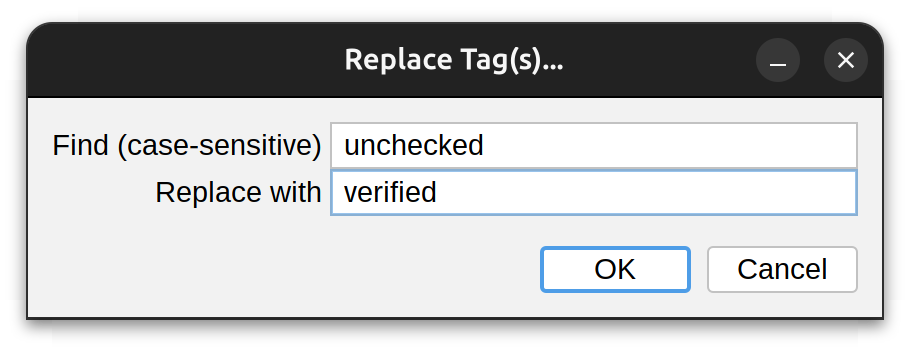
Replace…
Allows existing tag(s) to be replaced/swapped by new values. Note that SWC-type tags are not affected by this command.
Remove Tags…
Allows tags to be removed. Note that SWC-type tags are not affected by this command.
Refine/Fit ›
Fitted radii are only exported to SWC files when Replace existing nodes is chosen in Refine › Parameters….
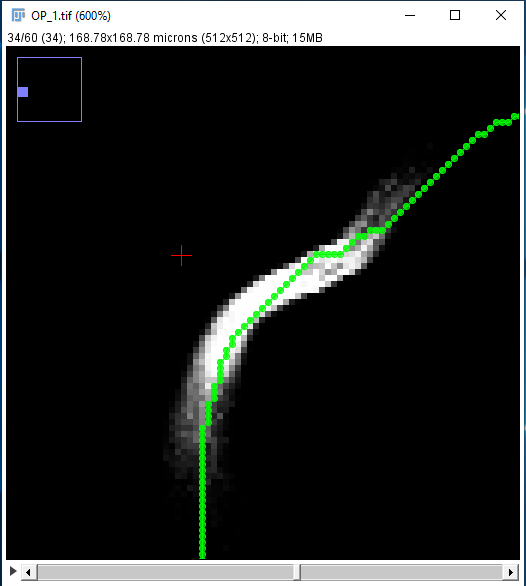
SNT can use the fluorescent signal around traced Paths to optimize curvatures and estimate the thickness of traced structures to sub-voxel accuracy. The optimization algorithm uses pixel intensities to fit circular cross-sections around each node. Once computed, fitted cross-sections can be used to: 1) Infer the radius of nodes, and/or 2) refine node positioning, by snapping their coordinates to the cross-section centroid.
Assuming you chose to fit both centroids and radii, a fitted path might look like the rightmost image below. Notice how the nodes follow the center line of the structure more closely, and how each node now has a non-zero radius approximating that of the traced axon.
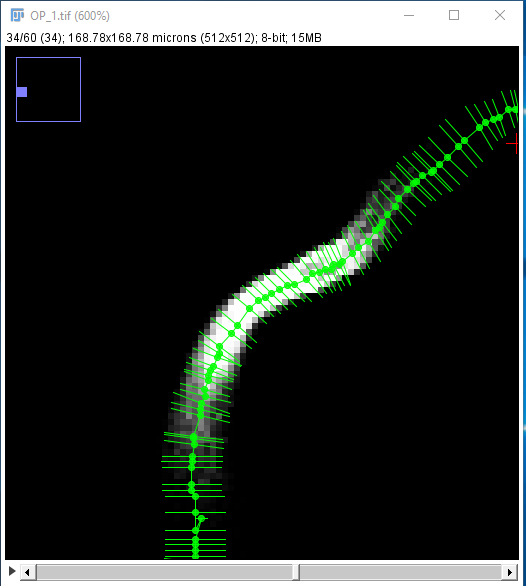
The Refine/Fit menu contains several commands:
Fit Path(s)…/Un-fit Path(s)/Apply Existing Fit
This is a dynamic menu item that will change depending on which Path(s) are currently selected. You can use it to 1) Fit selected Path(s), 2) Un-fit Path(s) that have already been fitted, or 3) Toggle cached fits that have not overridden the original path.
Explore/Preview Fit
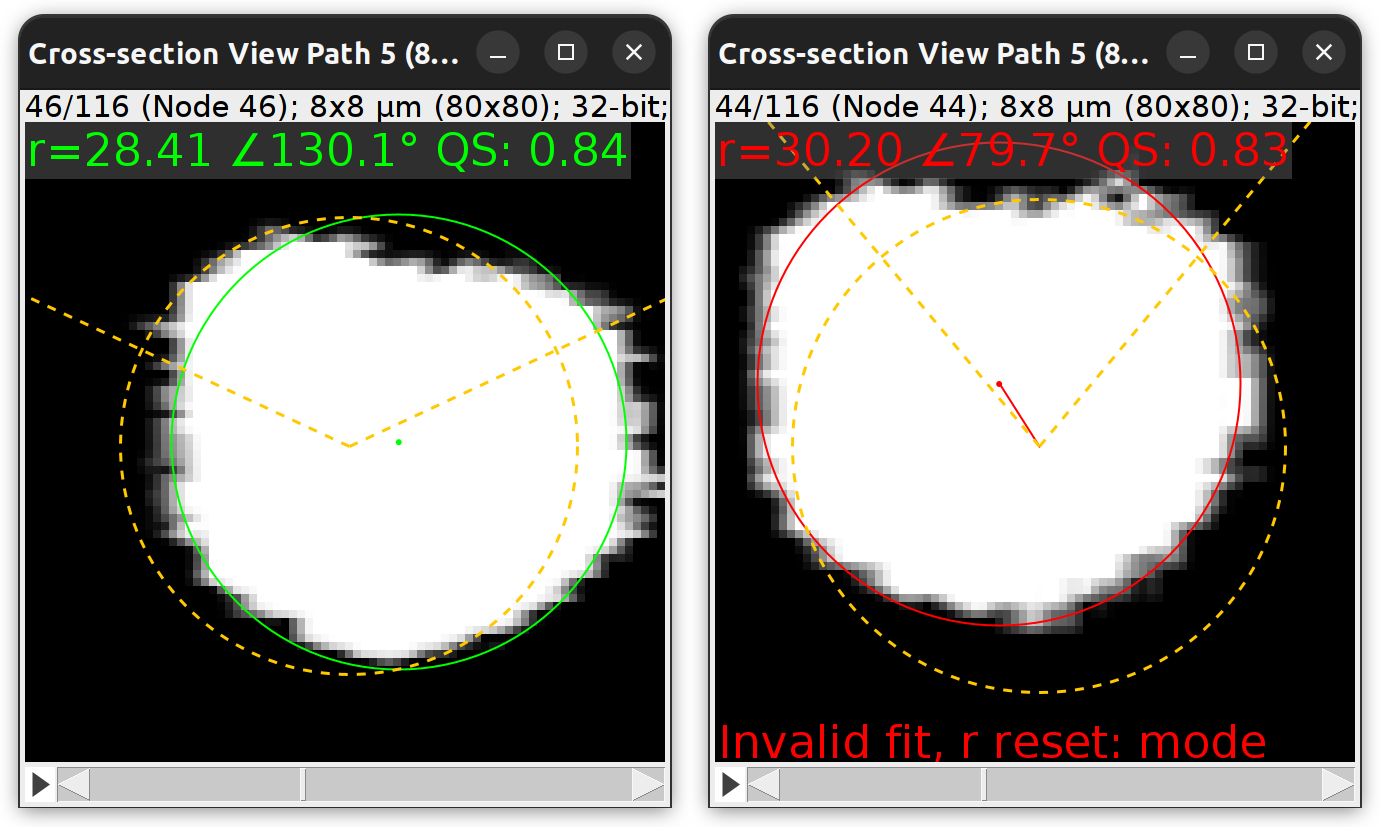
Explore/Preview Fit command: The ‘fly-through’ animation can be used to peruse successful (left) and failed (right) fits at each node location. Not that there is nothing inherently wrong about an invalid fit (in this example the failed fit is quite reasonable). The invalid classification only means that the fit violates at least one constraint put in place (see Fitting Parameters) to avoid rogue displacements of original coordinates.
Carves out a region of the image along and around each Path node, generating an animated cross-view (normal plane rendering) allowing to “fly-through” the result of the fitting operation. The animation is synchronized with the tracing image so that the active node in the animation becomes highlighted in the main image. The animation is annotated with the following details:
- Fitting score A “Quality Score” (QS) of fit, with higher values reflecting better fits (akin to a circularity score). It is normalized so that the worst fit in the path is set to zero, the best to 1.
- Angles The angle between a node and parent tangent vectors. It is displayed in orange (dashed lines).
- Modal radius of possible fits The mode of the radii of all the possible fits attempted by the algorithm at the given location. If the fitting fails, this mode can be used as a ‘best guess’ radius for that location (as per Refine › Parameters…). It is displayed in orange (dashed circumference) and is centered on the original node coordinates.
- Fallback strategy The strategy for radius value fallback as specified in Refine › Parameters….
- Fitted coordinates and radius Displayed in green when fit is valid, in red when invalid (filled circumference and dot). With invalid fits, the displacement between fitted and original coordinates is highlighted by a connecting line.
Discard Fit(s)…
Deletes the existing fit(s) for the selected Path(s), or all fits if no Paths are selected.
Parameters…
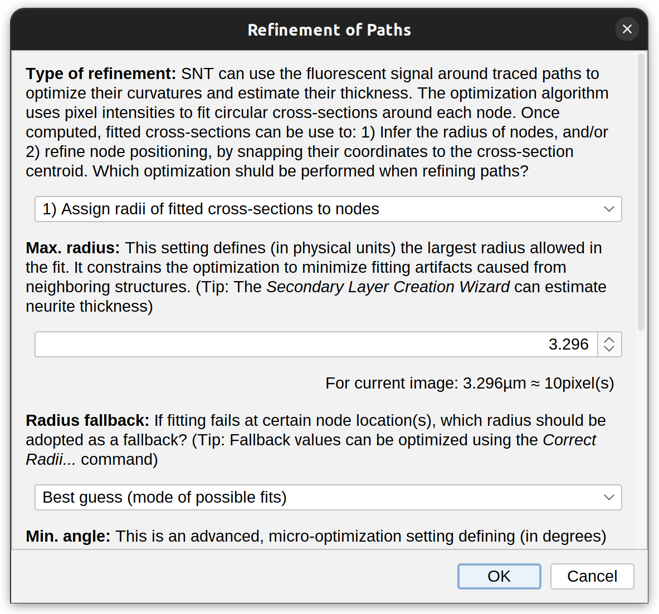
This command sets fitting options and should be run before computing a fit. Options include:
-
Type of Refinement Either 1) Assign radii of fitted cross-sections to nodes, 2) Snap node coordinates to cross-section centroids, or 1) & 2) Assign fitted radii and snap node coordinates
-
Max. Radius Defines (in physical units) the largest radius allowed in the fit. It constrains the optimization to minimize fitting artifacts caused by neighboring structures. This is the most critical parameter influencing the fit. Default is a distance matching ~10 pixels on each side of the path. If you are unsure about suitable values for your images:
- Estimate expected thicknesses using manual measurements or using the Secondary Layer Wizard
- As a rule of thumb, consider using 1.5–2× the largest radius in the traced structure
- When in doubt, start with a smaller radius and repeat fitting under small increments using Explore/Preview Fit to peruse the result
-
Radius fallback This setting defines what should happen when radii are being fitted but fitting fails at certain node location(s). It allows such nodes to be assigned a ‘best guess’ (see explanation of mode in Explore/Preview Fit), the smallest radius possible (i.e., minimum voxel separation), or NaN. Note that the latter may cause statistical measurements to fail. See Correct Radii for details on how to handle fallback values.
-
Min. angle This is an advanced, micro-optimization setting defining (in degrees) the smallest angle between the fitted node and parent tangent vectors. It minimizes abrupt jittering between neighboring nodes. For most structures, this value is expected to be between 60 and 90 degrees. Acuter angles are more permissive but may induce more drastic displacements between nodes.
-
Target image If a secondary tracing layer is being used, this setting defines with image data should be used for fitting.
-
Replace nodes Defines whether fitted coordinates/radii should replace (override) those of input path(s). Note that SWC export requires fitted values to override original coordinates/radii.
-
Multithreading The number of parallel threads to be used by SNT while fitting. By default, it is the number of threads specified in Preferences
Correct Radii…
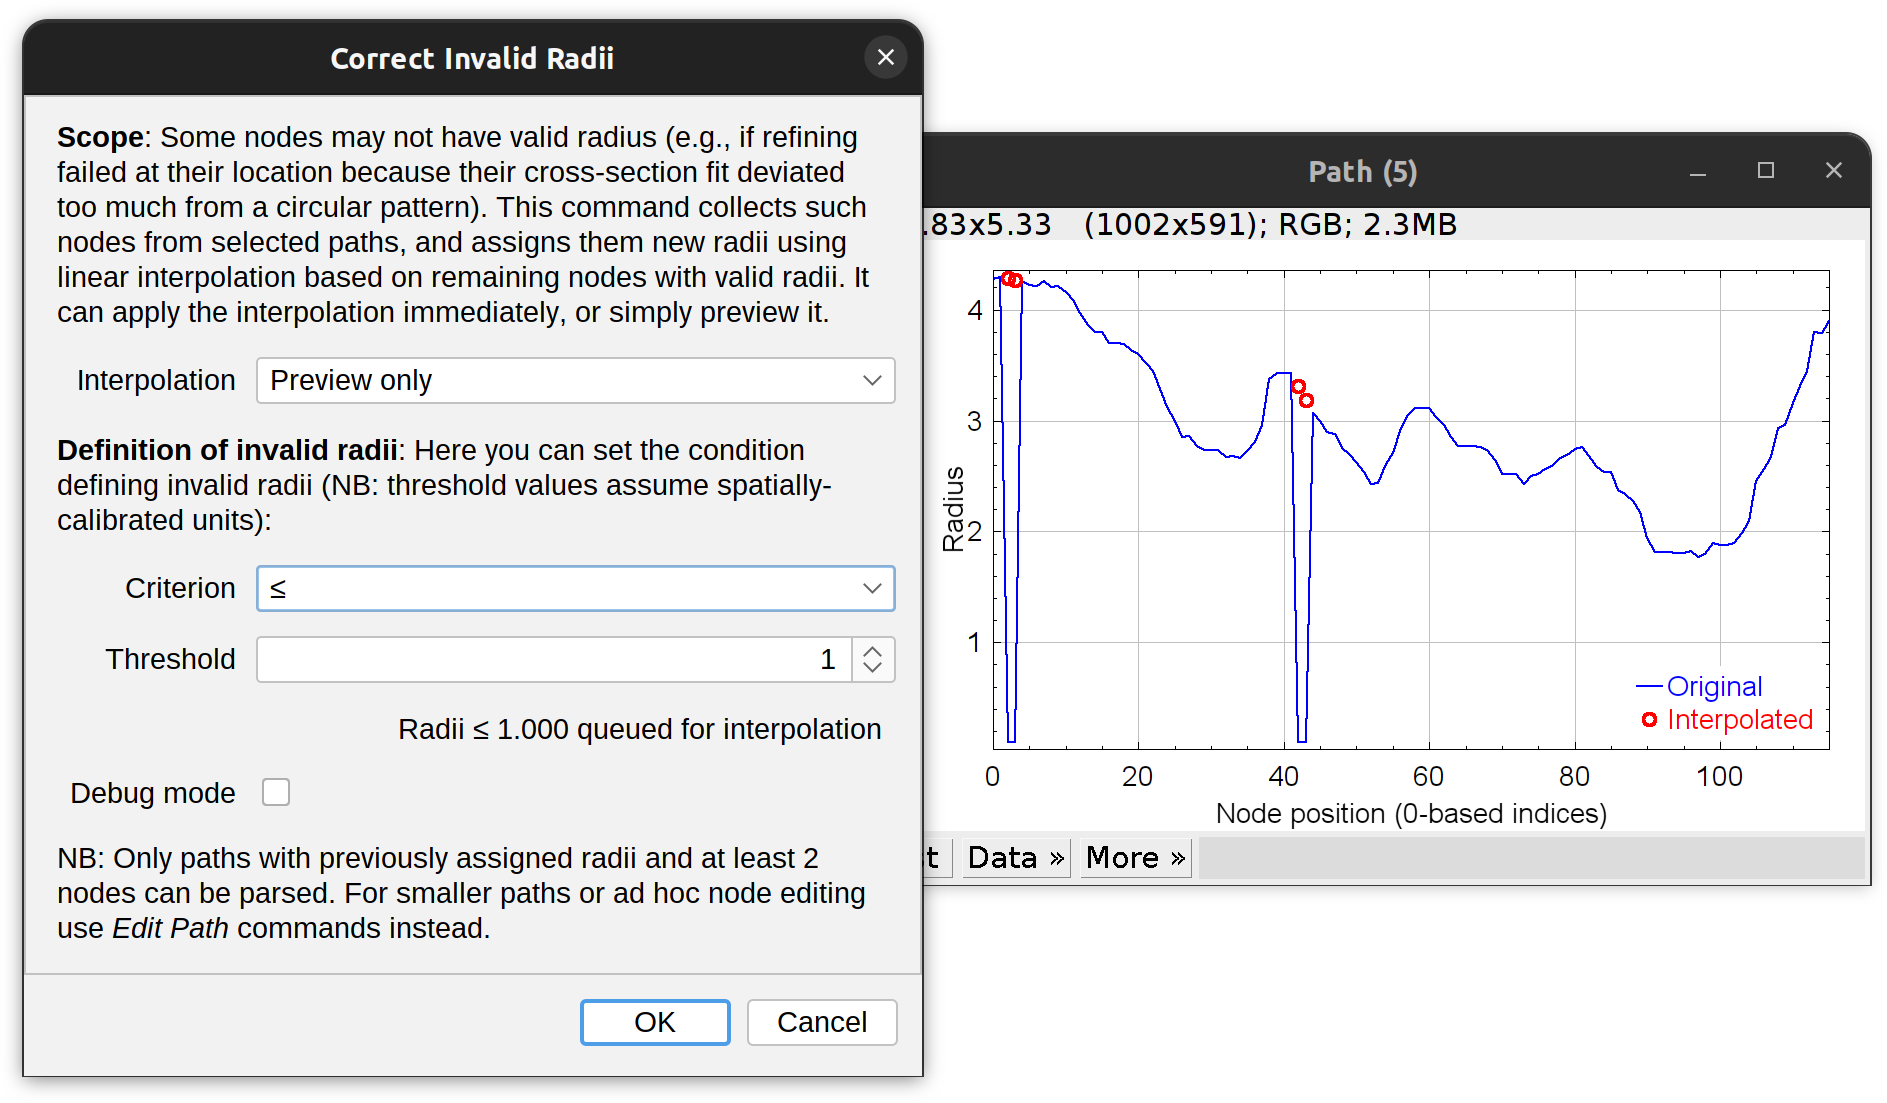 If the fitting fails at a certain location (e.g., because the shape of the cross-section is too irregular, or because the fitted centroid is too far off) the program will skip that node moving on to the next. Skipped nodes will retain their original coordinates but their radius may become unset (see Radius fallback in parameters). This command collects such nodes from selected paths, and assigns them new radii using linear interpolation based on remaining nodes with valid radii. It can apply the interpolation immediately, or simply preview it. Note that by default NaN and negative values are always corrected. The criterion specified in the prompt is used as an extra correction condition.
Fill ›
This menu contains options to start the filling process for selected paths. For detailed instructions see Filling: Step-By-Step Instructions.
Process ›
This menu lists commands pertaining to ROIs and image processing routines.
Convert to ROIs…
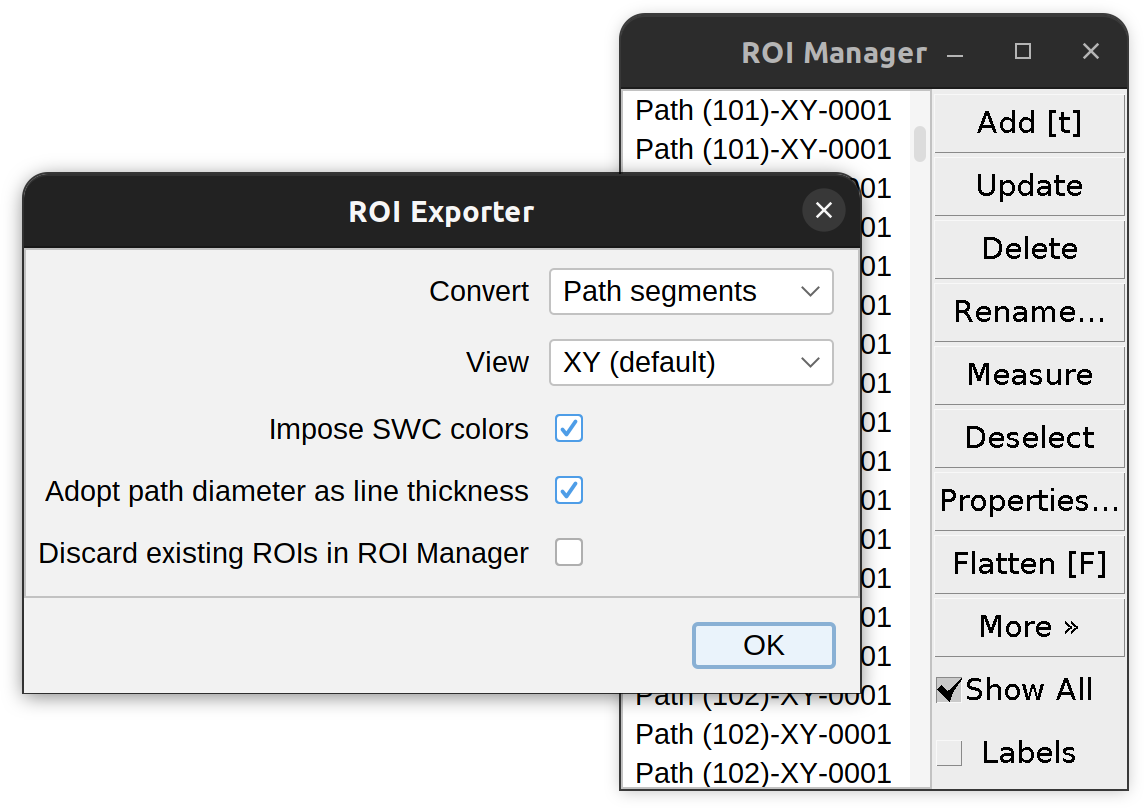 Allows conversion of Path(s) to ImageJ ROIs (Regions of Interest). Opens the ROI Manager, if closed. Options include:
- Convert Drop-down menu specifying the structure(s) to convert. Options are:
- Paths: Complete paths converted to a series of 2D polylines (1 per Z-plane)
- Branches: Either Inner, Primary, or Terminal. Note that this option assumes that the path(s) selected for conversion define a single cell, i.e., a single-rooted structure with no loops
- Branch points, Tips, and Root(s): Converted as multi-point ROIs
-
View Drop-down menu specifying which view to overlay the ROIs (applies only to 3D images/paths)
-
Impose SWC colors. If selected, ROIs are colored as per their SWC-type tag. Applies only to path segments, point ROIs are not affected.
- Adopt path diameter as line thickness Applies only to paths with known radius, point ROIs are not affected.
Skeletonize…
Outputs a binary image that is a topographic skeleton, ie, it generates an empty (zero-filled) image of the same dimensions of the one being traced, then paints a pixel at each node coordinates following the topographic rules of bitmap skeletons in which fork points, tips and slab voxels are determined by voxel connectivity. This command has a couple of configurable settings:
- ROI filtering: If an area ROI exists over the image (you may need to pause SNT to create such an ROI), then only paths inside it will be converted
- Run “Analyze Skeleton” after conversion Runs the AnalyzeSkeleton plugin on the skeletonized output image
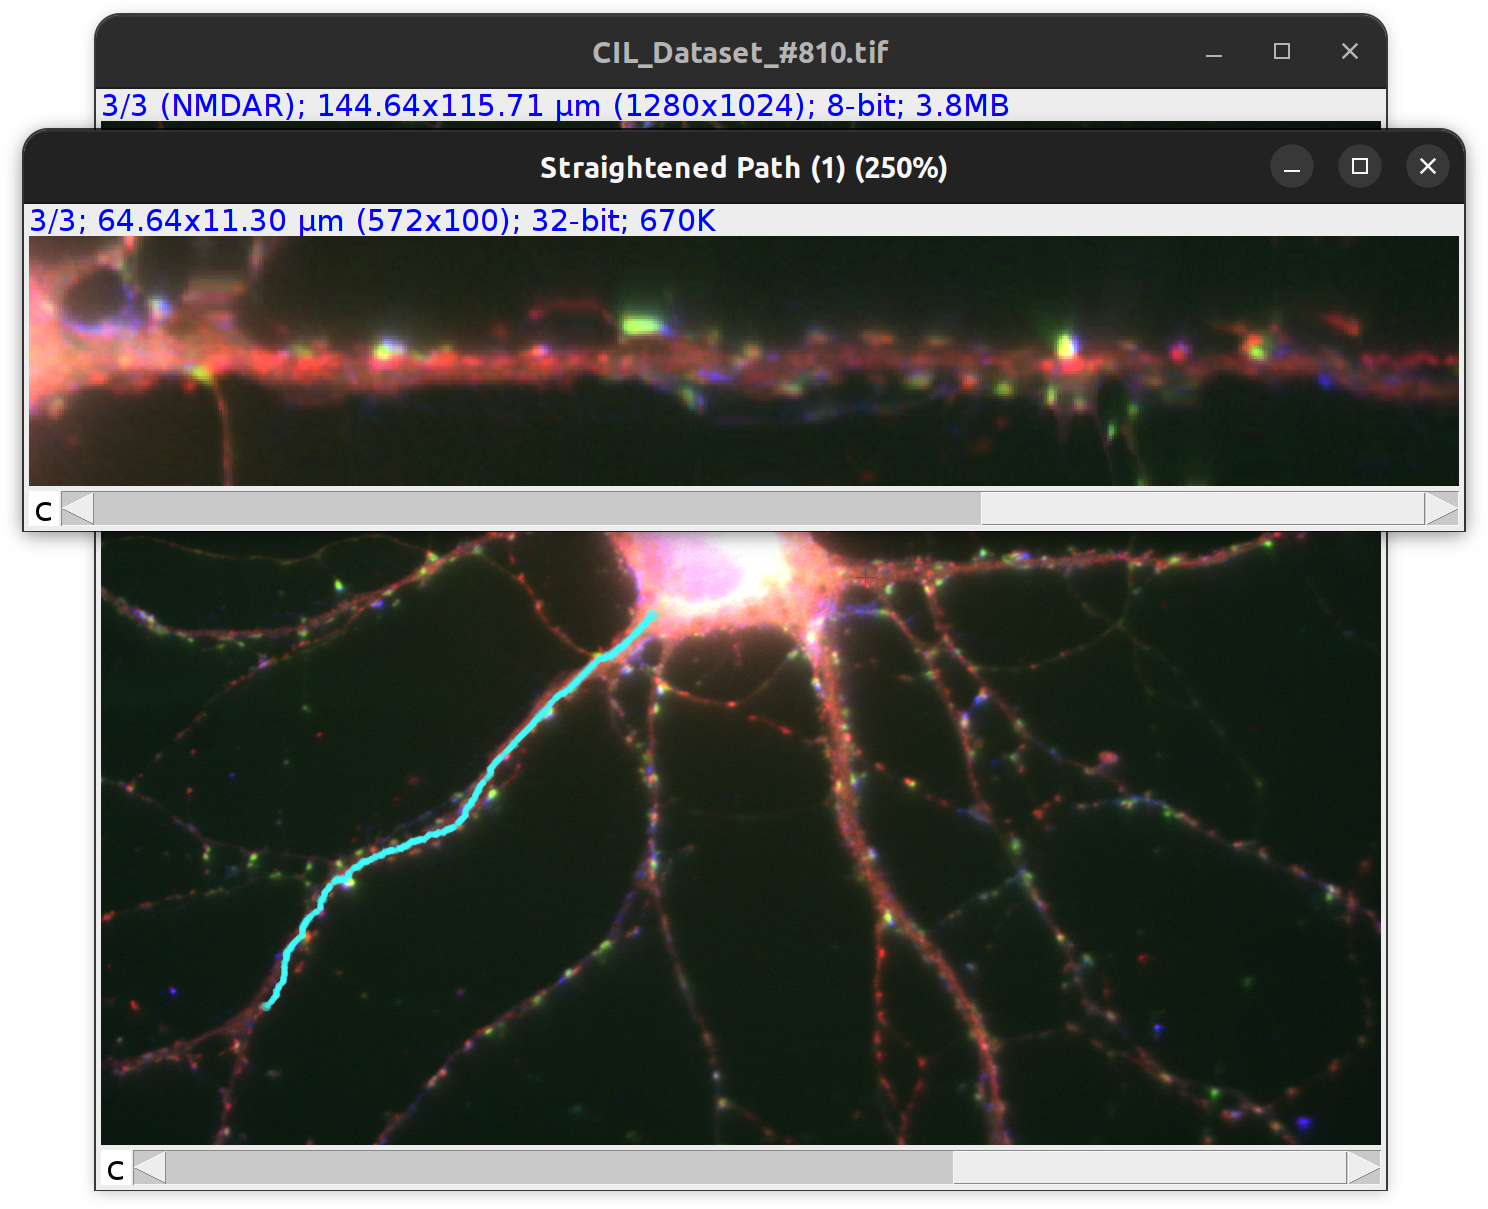
Straighten…
Creates a ‘linear image’ from the pixels associated with a single paths, similarly to ImageJ’s Straighten command. Useful to e.g., display intensity gradients or featured landmarks along a neurite.
Load Labkit With Selected Paths…
Uses selected Path(s) to train – in Labkit – a random forest classifier (a machine learning algorithm for semantic segmentation) aimed at classifying neurite-associated pixels. Described in Machine Learning.
Load TWS With Selected Paths…
Uses selected Path(s) to train – in TWS – a random forest classifier (a machine learning algorithm for semantic segmentation) aimed at classifying neurite-associated pixels. Described in Machine Learning.
Analyze ›
This menu contains several options which provide quick ways to analyze and visualize numerical properties of paths and associated branches. Note that these operations are only applied to the subset of currently selected Path(s). To apply these operations to the entire Tree, deselect all Paths first.
Color Mapping ›
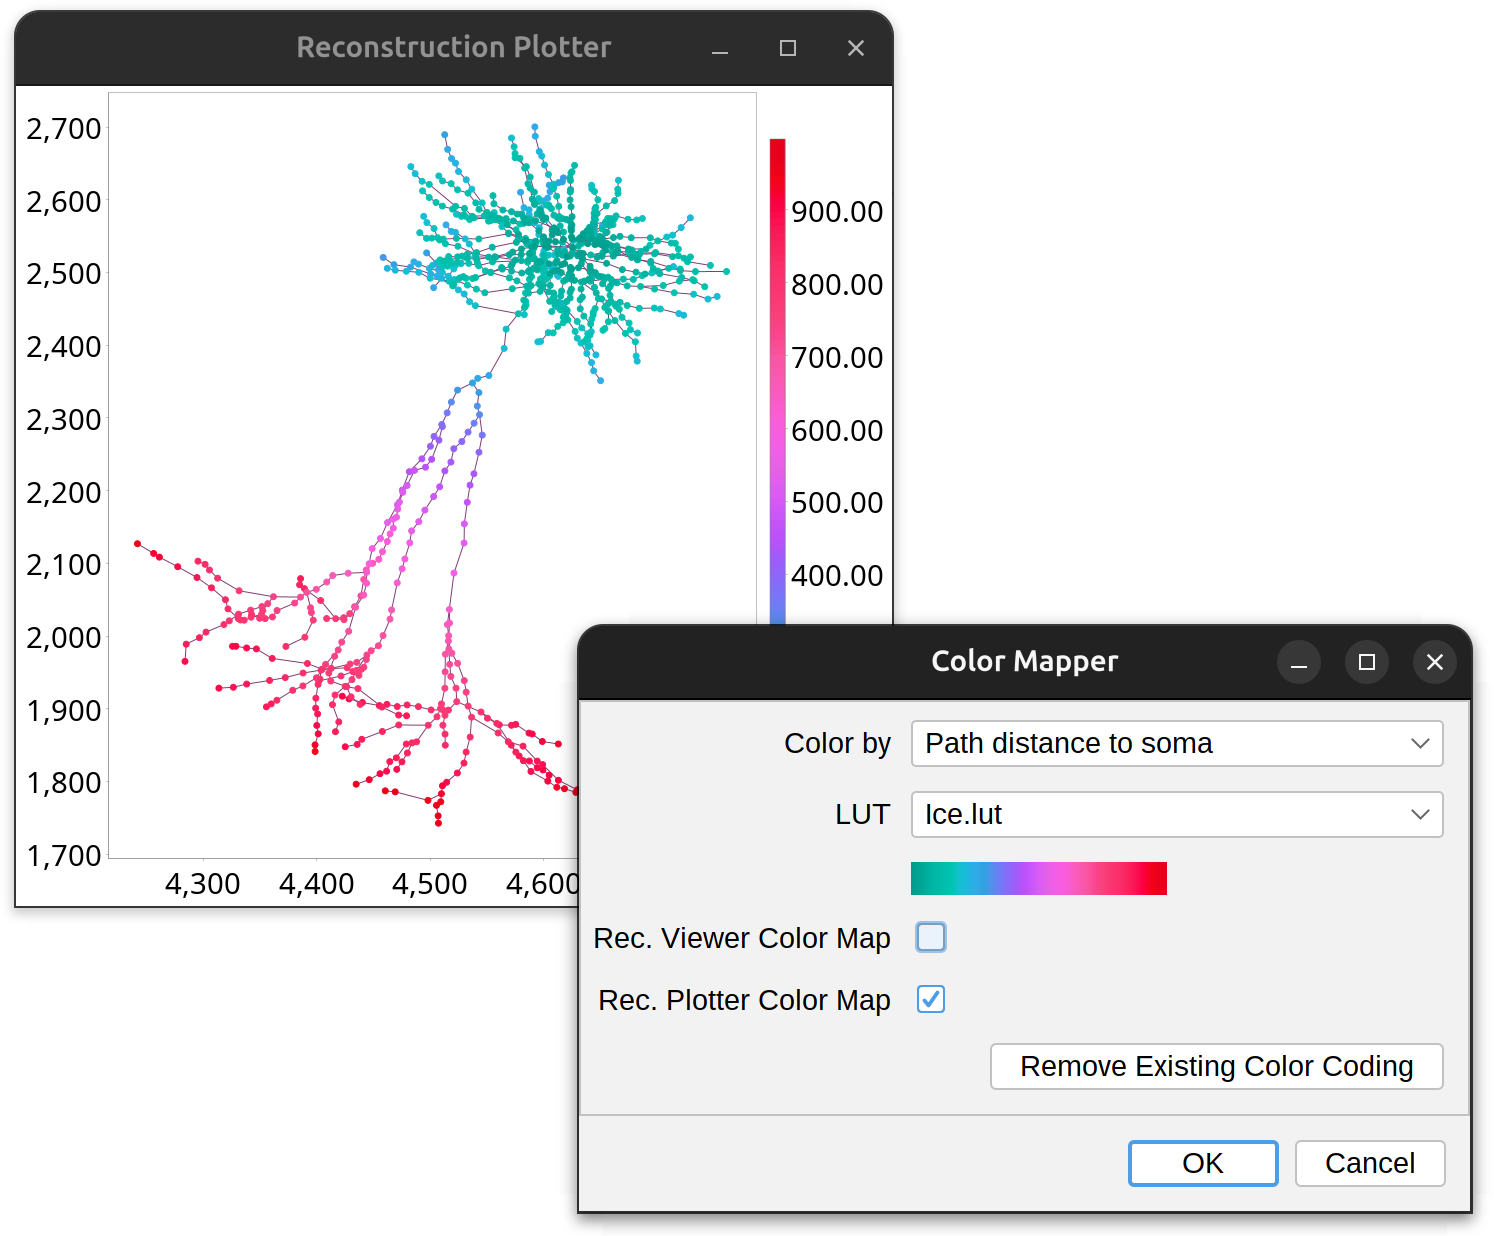
This menu lists commands for mapping morphological traits into lookup tables that are then used to render reconstructions. It contains commands to map path-based metrics or branch-based metrics: Path-based Color Mapping accepts any type of structures (i.e., any group of selected paths, even those belonging to different cells) but offers limited mapping metrics, while Branch-based Color Mapping requires structures to be valid mathematical trees (with more mapping metrics available). These commands prompt for the following settings:
-
Color by Drop-down menu containing the metrics which inform the color mapping.
-
LUT Drop-down menu containing the LUTs (“Look Up Tables”) that define the color ramps to be mapped to the metric. Available choices reflect all the LUTs installed in Fiji. The selected LUT is displayed in the color bar directly underneath.
-
Rec. Viewer Color Map If active, opens a Reconstruction Viewer instance with the selected paths mapped to the selected LUT.
-
Rec. Plotter Color Map If active, opens a Reconstruction Plotter instance with the selected paths mapped to the selected LUT.
The Remove Existing Color Mapping… command removes existing color mapping from the selected paths.
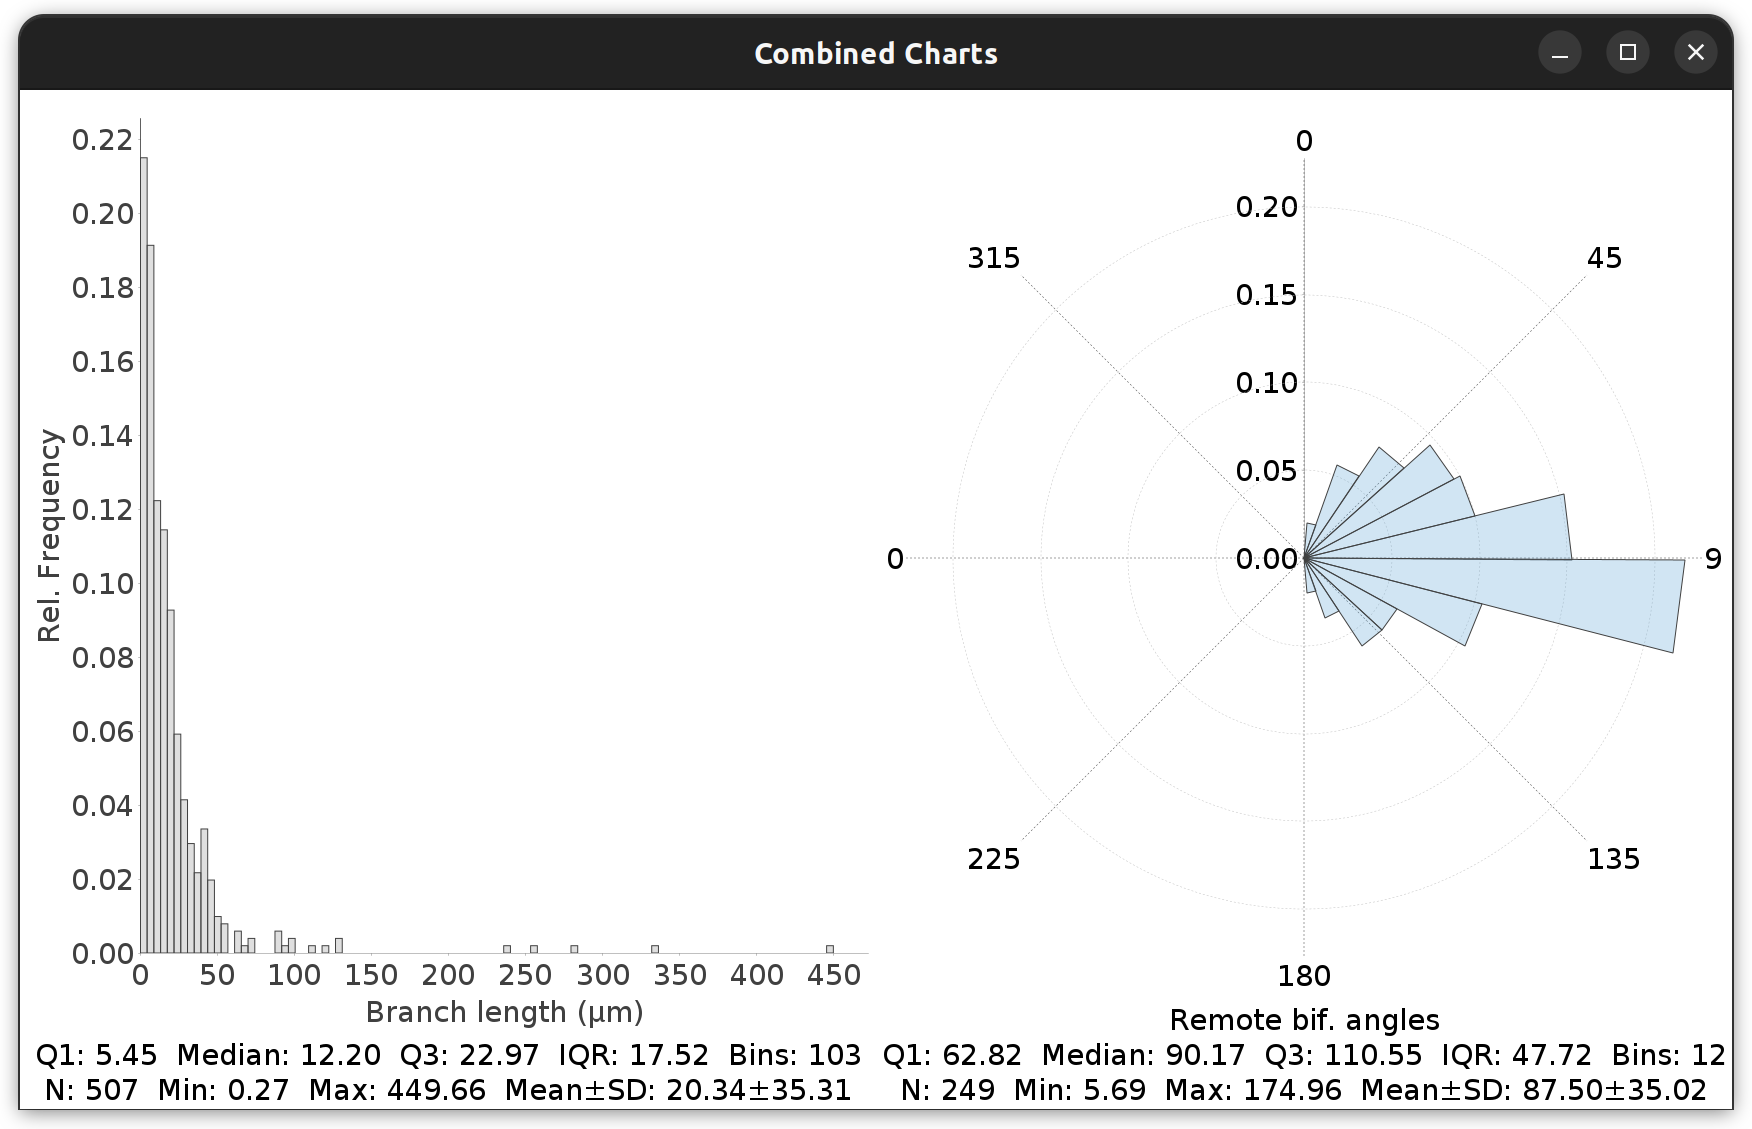
Frequency Analysis ›
Commands for retrieving histograms of selected path/branch metric(s). These commands prompt for the following settings:
-
Measurement Drop-down menu with the available metrics.
-
Polar Whether the histogram should be plotted using polar coordinates. Typically, this assumes that the data being profiled ranges between 0 and 360 degrees (e.g., bifurcation angles)
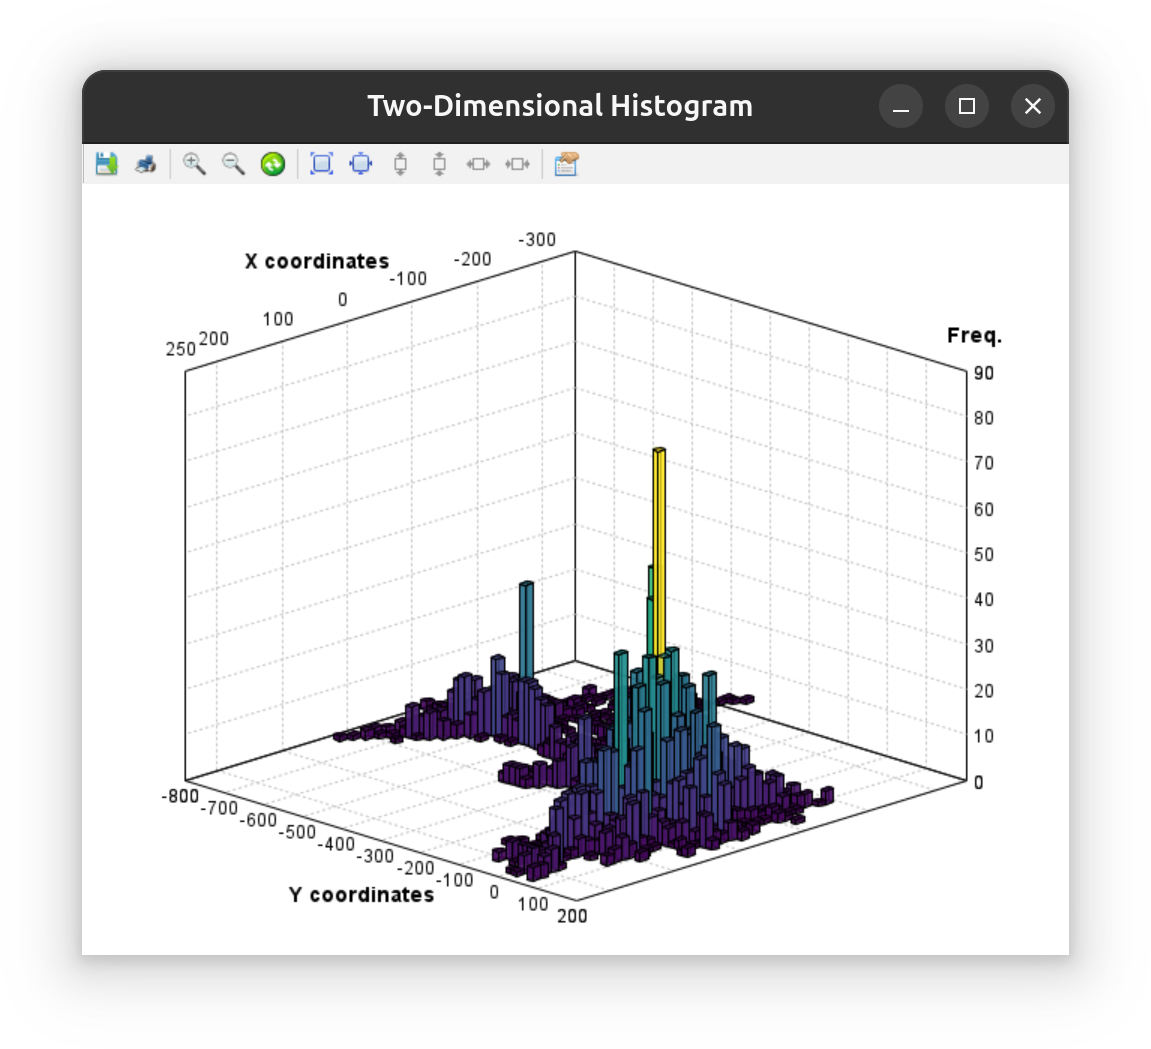
The menu also lists a command for displaying two-dimensional (bivariate) histograms in which two-distributions are plotted.
Measurements ›
Commands for retrieving a table of summary statistics for selected paths/cells. See Analysis › Measurements for details.
Multimetric Plot…
Plots a Path metric against several others.
Node Profiler…
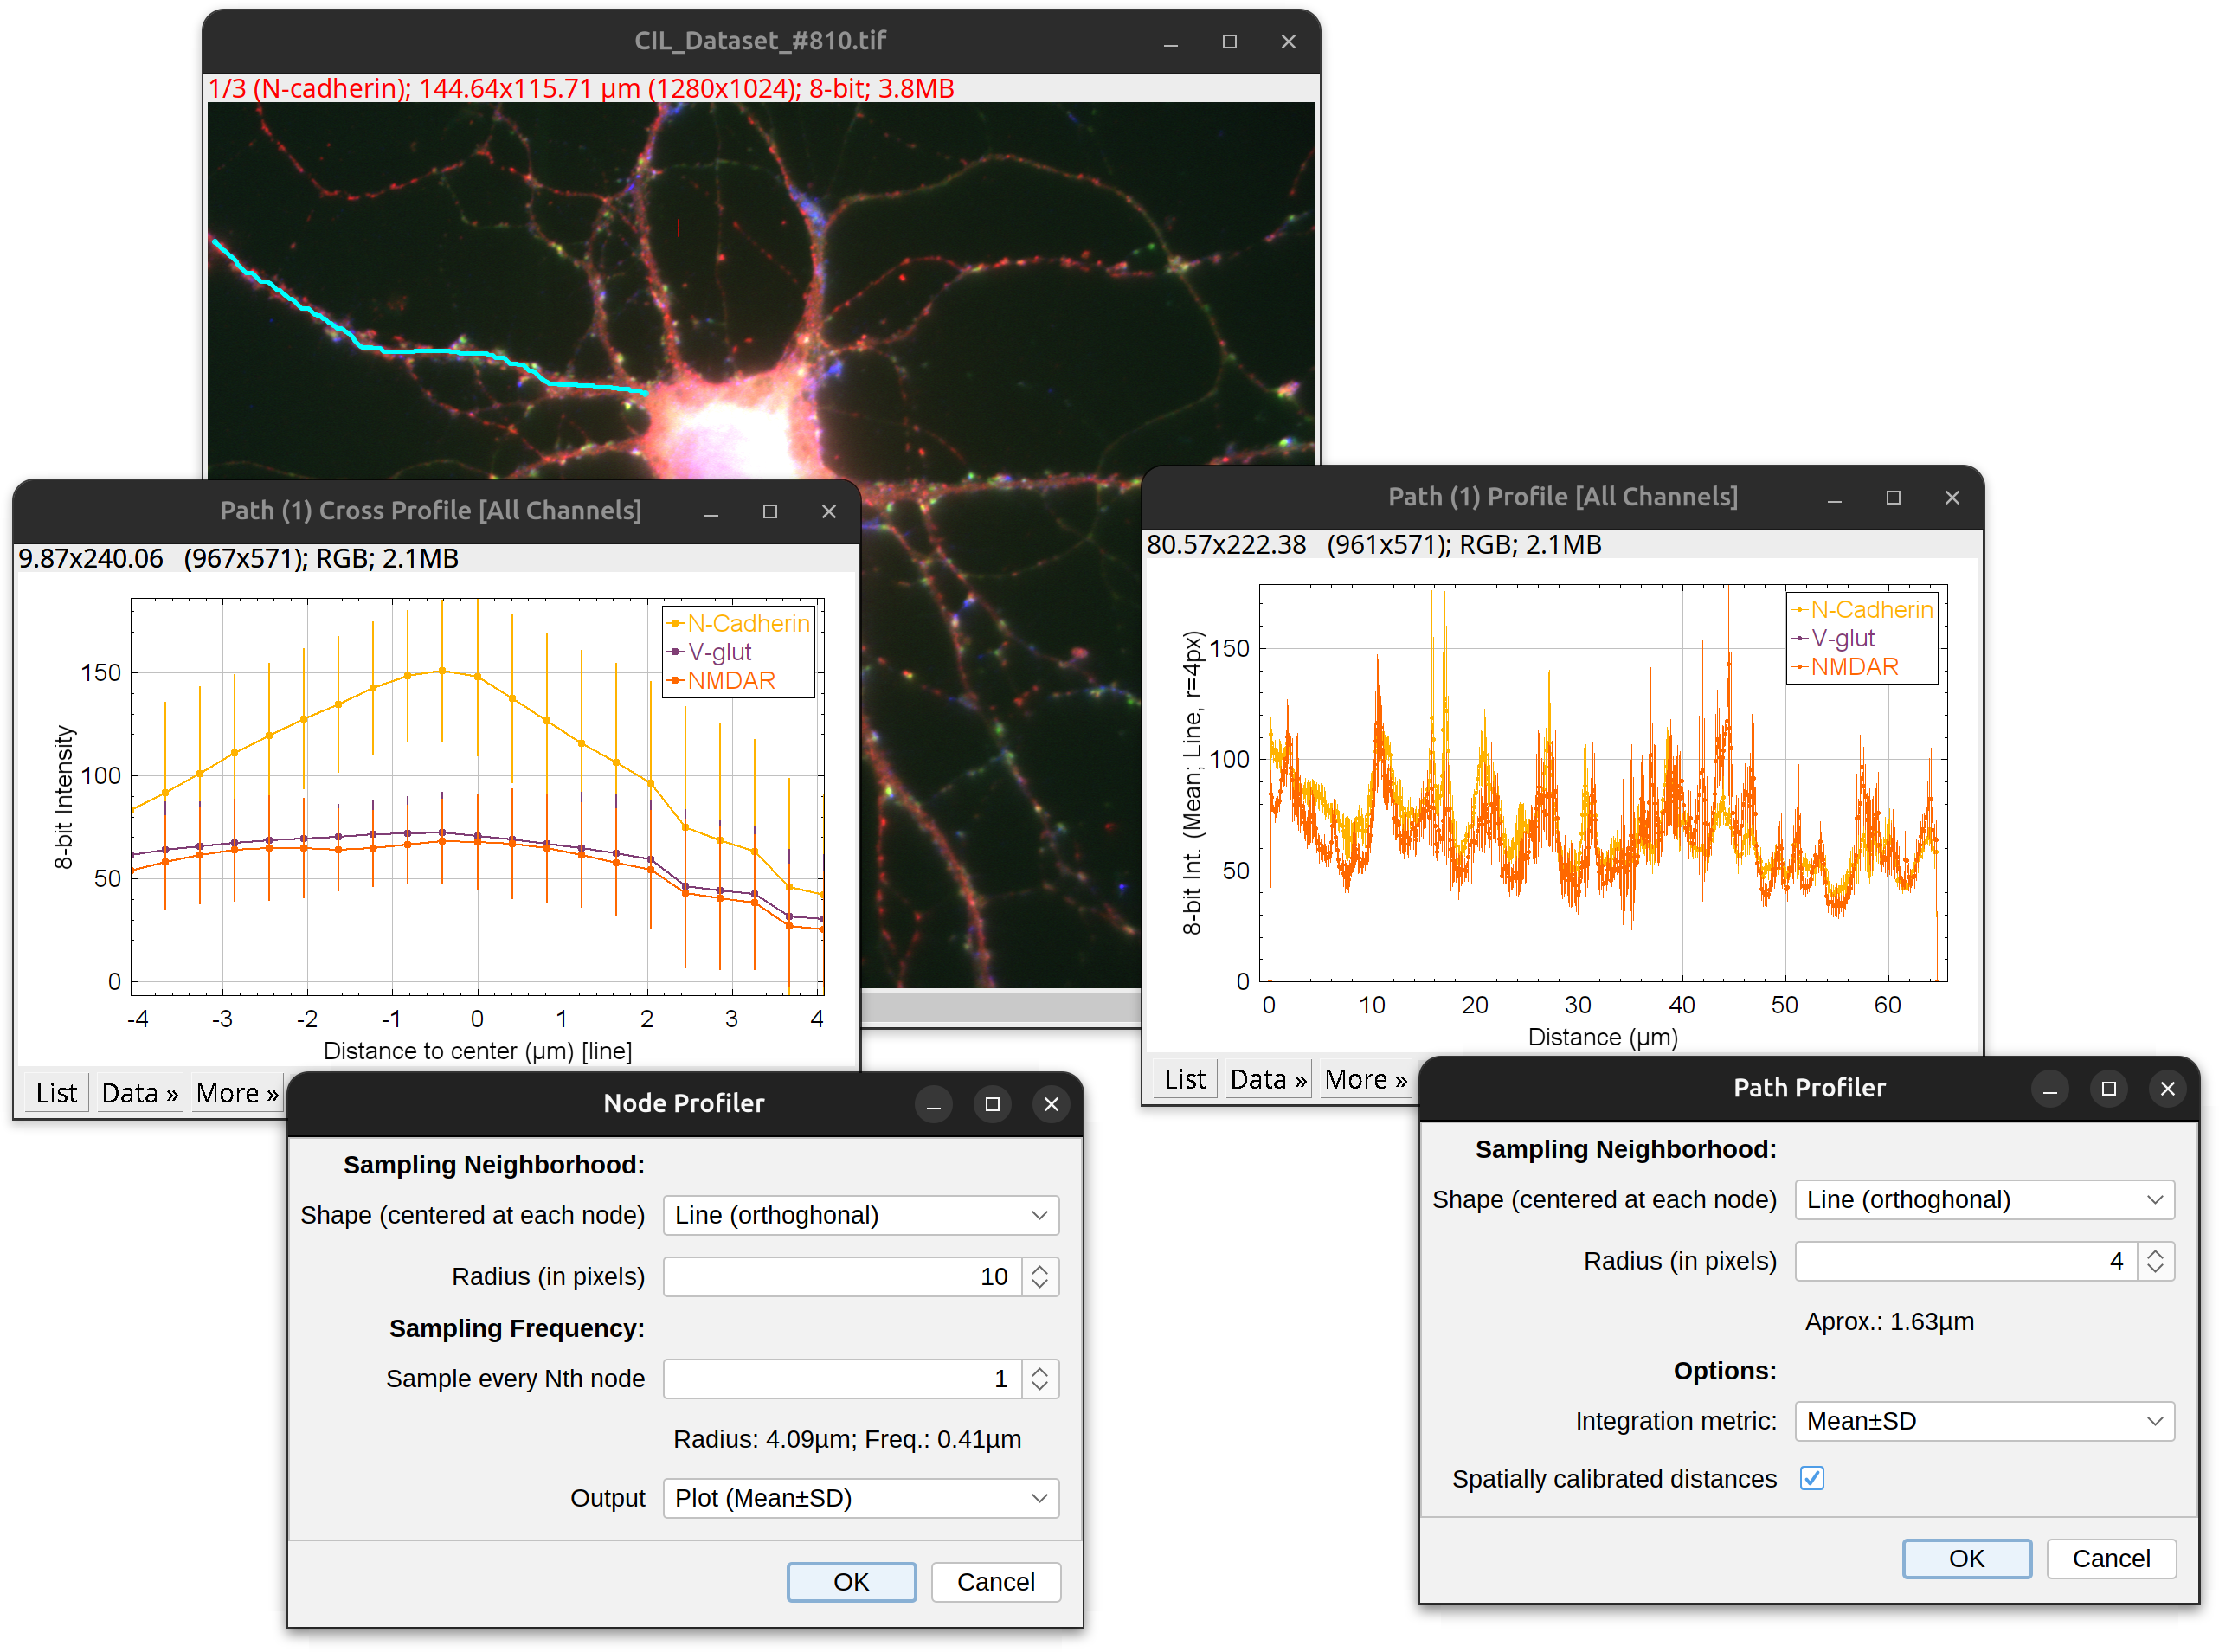
Displays a cross-section profile of the path. The X-axis represents distance across the path and the Y-axis a measure of pixel intensity. Pixel Intensities are retrieve using a ‘shaped cursor’ described in Path Profiler….
Path Profiler…
Displays an XY, Intensity vs. Distance plot of the intensities of pixels along path(s). The X-axis represents distance along the path and the Y-axis a measure of pixel intensity. Pixel Intensities are retrieve using a ‘shaped cursor’ that collects intensities at each path node. It is defined by two parameters:
- Shape The geometric shape centered at each node from which intensities are retrieved. Options include: Circle (hollow), Disk (filled), Sphere (filled), 2D line or None.
NB:
- Shapes are always centered at the node
- Shapes are assembled orthogonally to the path in the node’s plane. E.g., If 2D line, intensities are retrieved along a line perpendicular to the path at the node’s location (i.e., similar to the way radii of traced paths are rendered in the tracing image)
- If None is selected, a single intensity is retrieved at the node
-
Radius The radius (in pixels) of the shape, or half-length if shape is 2D Line. If set to zero and the path has radii, each shape is resized to the radius of its node.
- Integration metric The statistics (Mean, Median, Sum, etc.) integrating pixel intensities within shape.
Spine/Varicosity Utilities ›
This menu contains commands tools for analyzing at manually placed markers along paths such as dendritic spines or axonal varicosities. The starting point for such analyses are multipoint ROIs placed along paths. These are detailed in Step-by-step instructions.
Time-lapse Utilities ›
This menu contains commands tools for analyzing time-lapse videos, and assume that the same structure has been traced across multiple frames. Refer to Step-by-step instructions for more details.
Save Subset as SWC…
Exports the selected subset of Path(s) as an SWC file. Note the paths to be exported must include a primary path (i.e., one at the top level in the Path Manager hierarchy).
Filter Toolbar
 The filter toolbar allows paths to be searched and filtered quickly using tags, colors, SWC-type, or morphometric properties. The toolbar is organized in two sections: Text-based filtering and Propertied-based filtering:
Text-based Filtering
The text field is used for text-based searches (recent searches can be recovered through its history drop-down menu). The and buttons find the next/previous occurrence of the entered phrase, while the button highlights all occurrences of the entered phrase. The trailing icons within the text field control case-sensitive matching and/or wildcard support. Currently, two wildcards are supported:
?: any single character, e.g.,b?gmatches “bag” and “big”, but not “bang”*: any string, e.g.,* arbormatches both “axonal arbor” and “dendritic arbor”
Other search settings can be accessed through the text field drop-down menu, including a replace-by-pattern option.
Propertied-based Filtering
ID Filters
Allows filtering of Paths by SWC-type ID tags (axon, dendrite, glia process, etc.). Note that Paths must have been tagged using the Tag › Type menu
Color Filters
Allows filtering of Paths by color tags
Tag Filters
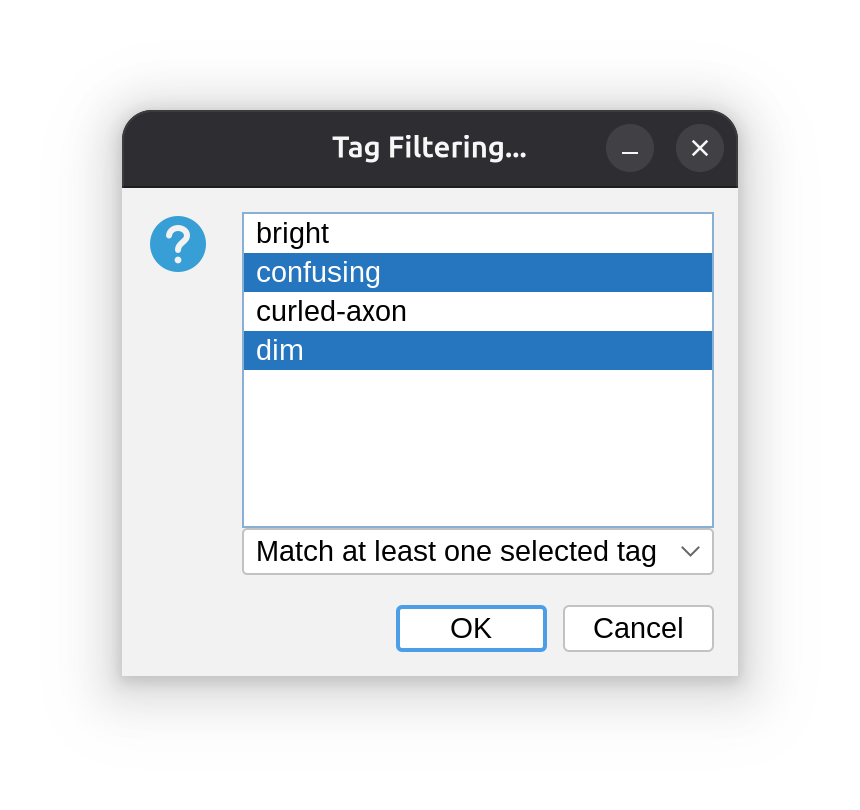
Allows filtering of tags set via the Tag › Other… command or the Proofreading Toolbar. The prompt will generate a multiple-choice list of the tags associated with the selected paths (all paths if none is selected).
Morphology Filters
Allows filtering of Paths by selected morphological properties (including cell identity). Note that these filters do not require Paths to be labeled using Tag › Morphology › . Typically a morphological filter requires an input range. Here are some examples:
| Filter | Example Query | Description |
|---|---|---|
| Path Order… | 1-2 |
selects all primary and secondary paths |
max-max (or max ) |
selects all paths with highest order | |
| Length… | 10-20 |
selects all Paths with lengths between 10 and 20μm |
max-max (or max) |
selects the longest path(s) | |
| No. of Children… | 0-0 |
selects all terminal paths |
| Path Contraction… | min-min (or min) |
selects the most ‘curvy’ or tortuous path(s) |
Combining Filters
Filters can be combined using the button: It restricts filtering to the subset of Path(s) already selected. Example: Selecting the thinnest paths between 10-50μm of length:
- › Length… query:
10-50 - Activate
- › Mean Radius… query:
min-min
Contextual Menu
The Path Manager contextual menu offers convenience options to collapse/expand selections, access children of Paths, etc.
Fill Manager
Provides controls for all filling operations. It is described in more detail in the Filling: Step-By-Step Instructions.

