The content of this page has not been vetted since shifting away from MediaWiki. If you’d like to help, check out the how to help guide!
Stack-Projections
A z-series is generally difficult to represent as a 2-D image for publication purposes. A montage will allow the 3-D dataset to be visualized in 2-D, but results in each frame being very small. There are several ways to “flatten” the 3D stack.
Maximum Intensity Z-projection
Z Project is a method of analyzing a stack by applying different projection methods to the pixels within the stack. This process may be used to highlight specific data from the stack and is accessed using Image › Stacks › Z Project…
When Z Project opens, it prompts for a start and stop slice, which will determine the range of the stack that will be included in the z projection. The default for these values is the endpoint slices of the stack.

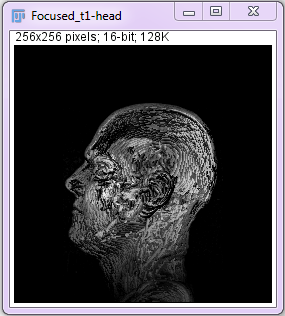
There are six different projection types to choose from: average intensity, maximum intensity, minimum intensity, sum slices, standard deviation, and median. The appropriate projection type will vary depending on the type of data being represented. As seen below, by applying a z transform to an MRI stack using different projection methods, the results can be very different. In the case of the MRI stack, maximum intensity is a preferable method to view the external head rendering while other methods of projection may be used to examine the internal brain components. These remaining methods also have their distinguishing characteristics, as seen by the median projection which gives the clearest rendering with the trade-off of less of filtering out more of the image in the projection.

The six projection methods clockwise from top left: average intensity, maximum intensity, minimum intensity, median, standard deviation, and sum slices.
Grouped Z Projector
The Grouped Z Project tool (Image › Stacks › Tools › Grouped Z Project…) works similarly to Z Project in terms of projection methods. This plugin uses the maximum intensity, average intensity, or sum slices projection method to apply a z projection to a stack of images. Unlike the standard Z Project, this plugin prompts for a group size that must be a factor of the total number of slices in the stack.
The plugin will then apply the selected projection method to subgroups with this number of slices, starting with the first slice. The result of running this plugin is a new stack where each slice is a a projection of a subset of the original stack. This is a useful plugin for analyzing large stacks where the change from slice to slice is still relevant, but not all slices need to be examined individually. If group size is set to equal the number of slices in the stack, Grouped Z Project will evaluate the stack in the same manner as Z Project.

Grouped Z Project applied to two halves of a stack, resulting in the two slices shown.
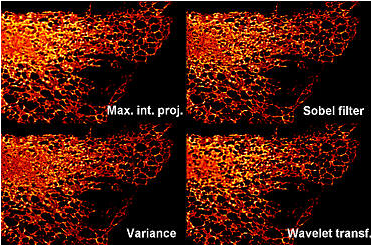
Sobel Filter Based Focusing
The Stack Focuser plugin uses a Sobel edge filter to calculate “best focus”. Try “3” for the kernel value in the first instance. The result is a “height map” showing the focused images. This plugin only works on 8- or 16-bit images. It can result in a “pixelly” image.
Result of the Stack Focuser plugin with ‘3’ as the kernel value.
Wavelet-transform Based Focusing
Authors: Daniel Sage, Jesse Berent, Brigitte Forster, Dimitri Van De Ville, Biomedical Imaging Group, Swiss Federal Institute of Technology Lausanne (EPFL), Switzerland, https://bigwww.epfl.ch/demo/edf/index.html.
This is a superior but slower, algorithm compared to the Sobel-filter focusing. The “Extended Depth of Field” plugin uses a wavelet transform (a more sophisticated transform compared to the Fourier transform) to calculate “best focus”. Run the plugin and check “Show 3D View”. This plugin will work with RGB images. A more detailed description of the wavelet transform extended depth of field plugin can be found at the authors’ website. A topology image is also generated. Please cite the authors’ papers below if you publish work using this plugin.
For more information see the following papers:
B. Forster, D. Van De Ville, J. Berent, D. Sage, M. Unser , “Extended Depth-of-Focus for Multi-Channel Microscopy Images: A Complex Wavelet Approach” Proceedings of the Second 2004 IEEE International Symposium on Biomedical Imaging: From Nano to Macro (ISBI’04), Arlington VA, USA, April 15-18, 2004, in press.
J. Berent, B. Forster, D. Van De Ville, D. Sage, M. Unser, “Extended Depth-of-Focus for Color Images in Bright-Field microscopy” Proceedings from the Autumn Meeting of the Swiss Society of Pharmacology and Toxicology, October 27-28, 2003, Basel, Switzerland.
Depth Coding
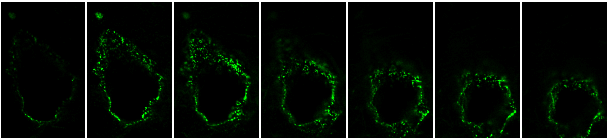
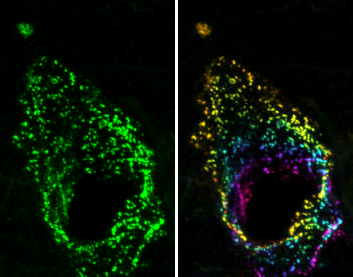
One method of preserving some z-information in a 2D image is to ‘depth-encode’ the stack. A monochrome 3D image can be colored so that the color represents the z-depth. Any subsequent projection will retain this z-encoding. An 8-bit stack can be depth encoded with the menu command Image › Hyperstacks › Temporal-Color Code. From there you will be able to choose a LUT as well as the start and end slices from the stack.
Another option is to use the plugin Z Code Stack for the results shown below.
Original stack:
Z coded stack:
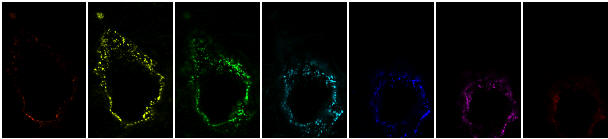
Maximum Intensity Projections of each:
3D Project
3D project (Image › Stacks › 3D Project) creates a 3D rendering from a stack and rotates the resulting object through a range of angles. When using this plugin, you will be prompted for a variety of initial specifications. Based on these values, the program will generate a stack depicting a 360 degree rotation of the 3D projection. There are three projection methods available: nearest point, brightest point, and mean value.

The prompt seen when running 3D project.
The 3D project plugin will prompt for the slice interval between slices. Depending on the image properties, this could refer to a particular measurement between slices, such as millimeters, or will default to the number of pixels if a measurement system is not specified. Based on the selection of the slice interval, you can influence the overall shape of the 3D rendering by stretching or compressing the image in the z direction.
Selection of the initial angle corresponds to the starting orientation of the volume while the total rotation will determine what views of the volume are rendered, as well as the number of slices in the final stack. Also impacting the number of slices included is the rotation angle increment, which determines how much the volume is rotated between two consecutive slices.
The interpolation tool is relevant for images where the spacing between slices is greater than 1.0 pixels. In this case, interpolation uses z-scaling to eliminate the gaps for the final 3D rendering. If the slice spacing is less than 1.0 pixels, the option will be ignored.
Opacity, transparency, and depth cues may also be specified.

At left, an image with surface depth cues at 100% and interior depth cues at 50%. The image on the right has surface depth cues at 100% and interior depth cues at 50%.
Try these initial settings:
- Projection Method: Use “Brightest point” method.
- Slice Spacing: This determines your aspect ratio of the stack. Biorad stacks are internally calibrated and this value should be correct unless you set the wrong objective in the Biorad software during acquisition.
- Interpolate: Used when slice spacing > 0. Check this option although it will slow down the renderer. For a large data set, it may be worthwhile having this “off” initially while you’re selecting the settings.
Volume Viewer
The Volume Viewer (in the plugins menu) provides 3D rendering of a stack as well as slices of the XY, YZ, and XZ planes. Volume Viewer also offers more detailed interpolation and viewing methods than some of the other 3D rendering techniques.
The different display modes contain many options with which you can view the rendering: ‘Slice’, ‘Slice & Borders’, ‘Max Projection’, ‘Projection’, and ‘Volume’.

Display modes from left to right: slice, slice & borders, max projection, projection, volume.
For all display modes, the position may manually be updated by holding the ‘Shift’ key and moving the displayed image with the mouse. Orientation may also be updated by adjusting the rotation values at the bottom of Volume Viewer: these values represent the degree of rotation along each axis and may be changed to provide a more concise orientation. When using the mouse to rotate the object, these values update automatically. The XY, YZ, or XZ planes can also be viewed at any time by using the buttons at the bottom of the viewer.
Beyond the display modes, the image may also be analyzed in different ways through the selection of an interpolation method. These are of especial importance for the ‘Slice’, ‘Slice & Borders’, and ‘Volume’ modes. The methods available are ‘Nearest Neighbor’, ‘Trilinear’, ‘Tricubic Smooth’, and ‘Tricubic Sharp’.

Interpolation methods clockwise from top left: nearest neighbor, trilinear, tricubic sharp, tricubic smooth.
The z-Aspect may be used to either stretch or compress data along the Z-axis while the X and Y axes dimensions remain unchanged. The sampling value can be used to control how many samples are utilized to blend the rendering’s values. Typically, higher sampling values will result in better quality results, though the tradeoff is a slightly slower processing time.
3D Viewer
This plugin is found in the plugins folder. The 3D Viewer uses a stack of images to visualize it in 3D space as a volume, a surface, or orthoslices. When the plugin is run, you will have the option to choose a name for the new image as well as the display method: volume, orthoslice, surface, surface plot 2D, or multiorthoslices. Color, threshold, sampling factor, channels, and starting time point may also be selected. The starting time point is used when inserting the rendering into a movie: the rendering will be present starting at the time point specified. At this time point, modification of the image is possible within the viewer. Many of these variables may be updated in the viewer once the rendering is generated.

The window seen when 3D Viewer is opened.
To use the 3D Viewer, an 8-bit or RGB image is required. If used on another type of stack, the plugin will have a prompt for you to choose to convert to these types.
The current display mode may be changed by clicking Edit › Display As. This will let you choose from ‘Volume’, ‘Orthoslice’, ‘Multi-orthoslice’, ‘Surface’, and ‘Surface Plot 2D’. When using the ‘Orthoslice’ mode, you can right click on the viewer and select ‘Adjust Slices’ to update the placement of the x, y, and z coordinates. You can also press the X, Y, or Z keys in combination with arrow keys to move the slices.

Example of the type of volume seen in 3D viewer.
The Edit menu supplies some more options to change the color and transparency of the rendering. Edit › Change Color can be used to edit the color of the rendering, including an option to apply to all time points. Edit › Change Transparency may be used for a straightforward way to edit the transparency for all types of displays. Edit › Change Channels provides the option to select or deselect any combination of the red, green, and blue channels. Edit › Adjust Threshold can be used for both the ‘Volume’ and the ‘Surface’ viewing options.
Edit › Transformation › Set Transform can give more control over the placement of the rendering by specifying rotation origin and rotation axis. You can also use the 3x4 matrix in “Set Transform” to specify the x, y, and z axes of the transformed coordinate system in the first three columns and the vector from the old origin to the new origin in the fourth column.
Other Volume Rendering Methods
3D reconstruction methods where the object will appear semitransparent include 360° 3D-project and Rocking 3D-project. 360° 3D-project produces a stack with a 360° rotation of the z-transform. The results will look similar to those generated with the Grouped Z Projector plugin. If you want the stack to just rock back and forth, use the Rocking 3D-project macro.
Surface Render
VolumeJ is a 3D reconstruction method where the object surface will appear opaque, giving a more “solid” look to the object.
VolumeJ’s interactive rendering option is currently not working. Other modes should work.

- Select the volume stack to render.
- Select the classifier (i.e. rendering algorithm). Choose ‘Gradient no index’ for grayscale stacks; choose ‘Ramp + index’ for RGB stacks.
- Set the classifier threshold as the intensity of the “surface” of the object. This can be determined using the Image › Adjust › Threshold command.
- Set the classifier deviation. Low values tend to result in sharper edges while higher values may be unfocused. A good compromise is 1-2.
- Set the rotation angle (try -20 in the first box to rotate the volume backwards slightly).
- Ensure that the aspect ratio is correct: VolumeJ should pick up the spatial calibration of the stack if it is present.
- Set the scale as 0.5 for faster preliminary renderings. Set it to 1 or 2 for the final rendering.
- Click on the “Render” button to start rendering.
- Click on “Stop renderer” if you’ve made a mistake.
Stack Reslice
This generates a “side-view” of a stack along a user defined line. Select part of a stack to be axially sectioned using the line ROI tool from the toolbar. Select the menu item Image › Stacks › Reslice after drawing a straight line or rectangle onto an open stack.
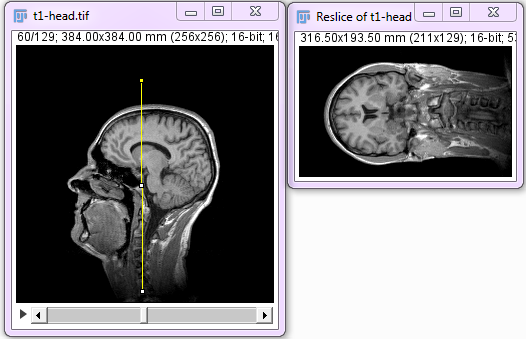
Stack resliced along a vertical axis.
From this point, you can generate a new stack by reconstructing the slices along the selection. If you drew a line, the new stack will be from the angle of this new line, as if it “cut” through the stack. You’ll also be able to specify the number of slices to include in the stack and the spacing between the slices. Since you will be specifying both values, it is up to you to determine how many slices are needed to represent the region of interest in a substack. If you drew a rectangle over the initial stack, you won’t be able to specify the number of slices, though you can still control the spacing. The application will then create a new stack depicting the region of interest chosen with the rectangle.
The Dynamic Reslice plugin is used the same way as Image › Stacks › Reslice. This plugin will dynamically update the slice generated as the ROI is changed on the original image.
Orthogonal Views
A straightforward method to visualize 3D renderings is through orthogonal views, accessed via Image › Stacks › Orthogonal Views. This method may be used with a stack to display the XZ and YZ planes at a given point in the 3D image. When Orthogonal Views is opened, windows containing the two planes will dock alongside the original stack, with the intersection of the yellow lines on the stack indicating the point in the stack that is being analyzed. The views in the XZ and YZ planes will update automatically, either as the stack is set to a different slice or the lines are manually adjusted on any of the three windows.

Example of image seen with orthogonal views.
Stack Slicer
This plugin is an alternative to the orthogonal views option. After making a point selection on the original stack, you can run the plugin to generate images of the XZ and YZ planes intersecting with this point. By selecting the rotate YZ option, the image of the YZ plane will rotate 90 degrees counterclockwise.
When running the plugin, it is possible to adjust the aspect ratio of the three axes. The stack is initially assumed to contain cubic voxels, or, a 1:1:1 ratio. These numbers may be modified to change dimensions of the XZ and YZ plane images. The gap between the Z planes may also be updated from its initial value of 1 pixel.
Stereo Pairs and Anaglyphs
To create an anaglyph of two images, you can use the Two Shot Anaglyph plugin. This plugin may be used with two RGB Color images of the same dimensions to make a stereo image.
Volume-rendered anaglyphs
This is an adaptation of the methods described at https://imagej.net/nih-image/more-docs/confocals.html.
This plugin can use your stack to create a side by side stereo pair, a red-cyan anaglyph, a red-green anaglyph, or a rotation movie based on user specifications. The plugin will let you specify which of the stereo pair projections you want as well as the angle of rotation between the pairs. Typical values are 6-9°.
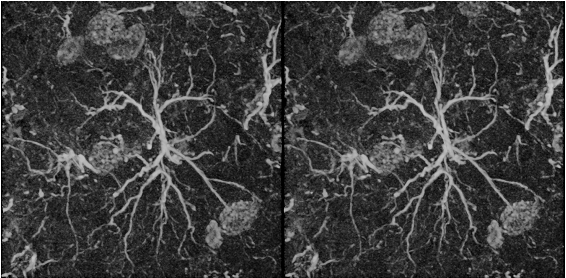
Stereo pair
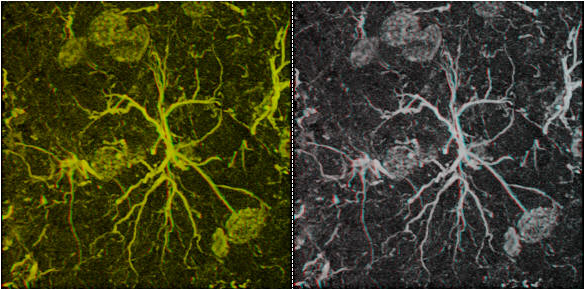
Red-green anaglyph at left, red-cyan anaglyph on the right.
Surface-rendered anaglyphs
Surface stereo pairs for a stack are simply made with VolumeJ’s stereo pair button. This generates a stereo pair with a 5° difference.
These two images can be merged to form an anaglyph using either the menu command Image › Color › Merge channels or the plugin “Colour merge”.
The “left eye” needs to be red; the “right eye” green or cyan.
Surface rendered anaglyph movies can be constructed using VolumeJ following an approach from Harvey Karten and Joel Sheffield.
- Surface render your z-series with a “Cine frame increment” of 6-9°.
- Duplicate the surface rendered movie.
- Delete the top slice from the original movie.
- Delete the last slice from the duplicate movie.
- Merge the stacks using the menu command Image › Color › RGB merge.
- Assign the duplicate stack as red and the original stack as green. For Red-Green anaglyphs, set blue to be none. For red-cyan anaglyphs, set the blue channel to be the same as green.