The content of this page has not been vetted since shifting away from MediaWiki. If you’d like to help, check out the how to help guide!
Scientific visualization is a set of techniques for graphically illustrating scientific data, enabling scientists to better understand, illustrate, and glean insight from their data.
Getting Started with Simple Visualization Options in ImageJ
Pseudocolor Image Look-Up Tables (LUTs)
A pseudocolor image is a single channel gray image (8, 16 or 32-bit) that has color assigned to it via a lookup table, i.e. a LUT. A LUT is a predefined table of gray values with matching red, green, and blue values so that shadows of gray are displayed as colorized pixels. Thus, differences in color in the pseudo-colored image reflect differences in intensity of the object rather than differences in color of the specimen that has been imaged.
The LUT Menu of ImageJ contains a large collection of lookup tables that can be applied to a pseudocolor image.
In the ImageJ user interface, LUTs are always 8-bit. When working with an image of higher bit depth, its intensity values are binned into 256 levels between minimum and maximum (see section Brightness/Contrast), and the LUT is applied onto these binned levels.
More information on this topic can be found on the Color Image Processing page.
Fluorescence images are usually acquired without color information (i.e. by monochrome cameras or with photomultipliers): each channel contains just intensity values. To display a multi-channel fluorescence image in composite mode (i.e. an overlay of all channels), each channel can be assigned a monochrome false-color LUT, e.g. ‘Red’, ‘Green’, ‘Blue’, ‘Cyan’, ‘Magenta’, ‘Yellow’, etc.
When analyzing quantitative data in an image, a false-color LUT (in this case also referred to as color map) can increase the visibility of low-contrasted features in the image and help the human eye to compare different images.
Here’s a list of recommended options to choose a LUT:
| LUT Name | Properties | Common Usage | Histogram |
|---|---|---|---|
| mpl-viridis |
|
Quantitative display of positive values on a continuous scale |

|
| HiLo |
|
Assessment of over-/under-exposure in an image |

|
| phase |
|

|
For further reading about color maps, see [1] and [2]
Adjusting your Image in ImageJ
The Adjust submenu contains commands that adjust Brightness/Contrast, Threshold levels, and image Size.
Visualization of Volumetric Image Data
Here we summarize some of the 3D visualization plugins in ImageJ.
| Plugin Name | Short Description | Highlights | Plugin Snapshot |
|---|---|---|---|
| 3D Viewer | A tool for hardware-accelerated visualization possibilities for image stacks, using the Java 3D library. |
|

|
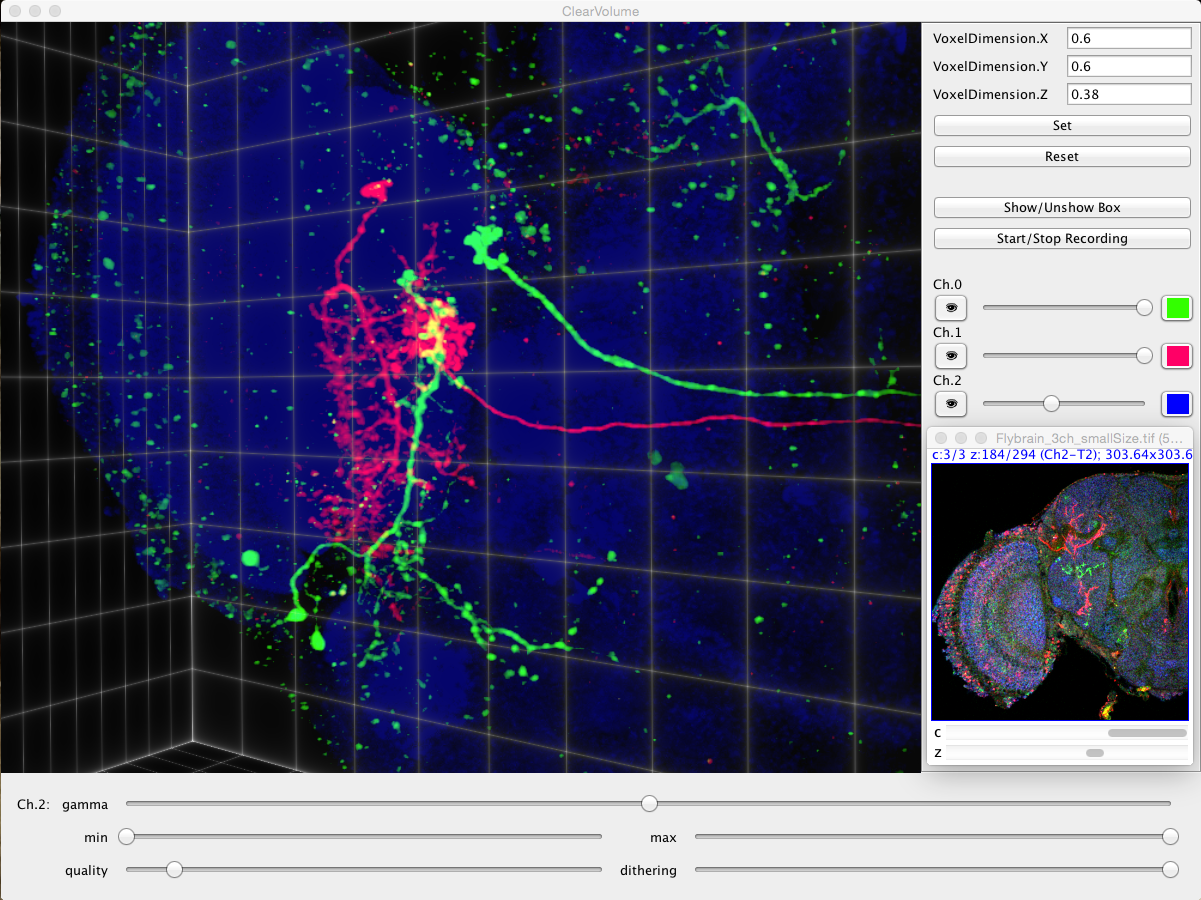
| ClearVolume | A tool for live rendering volumetric multi-channel data. |
|
 |
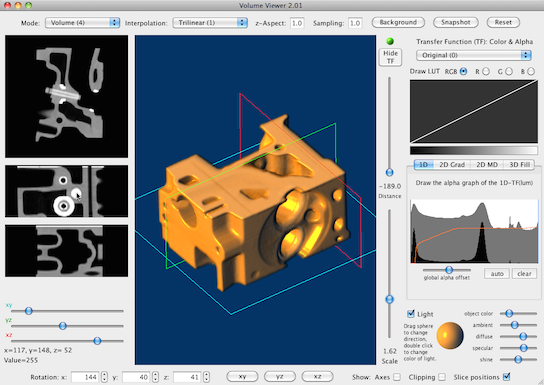
| Volume Viewer | A tool for 3D reslicing and threshold-enabled 3D visualization. |
|
 |
| sciview | A tool for 3D visualization capabilities for images and meshes. |
|
 |
Making Plots in ImageJ
The Basics: ImageJ v1.x Plot Tools
Available Plugins for Making Plots in ImageJ
Plotting tools available via scripting…
- JFreeChart (used by Directionality)
- Matplotlib
Making Figures in ImageJ
Available Plugins for Making Figures in ImageJ
Recommended ImageJ Plugins for ‘Big Data’ Visualization
Here we summarize some of the ‘big data’ visualization plugins in ImageJ.
| Plugin Name | Short Description | Highlights | Plugin Snapshot |
|---|---|---|---|
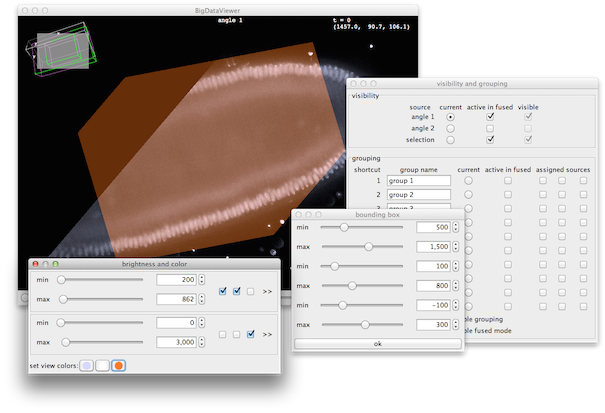
| BigDataViewer | A tool for interactive browsing of arbitrarily large image datasets. |
|
 |
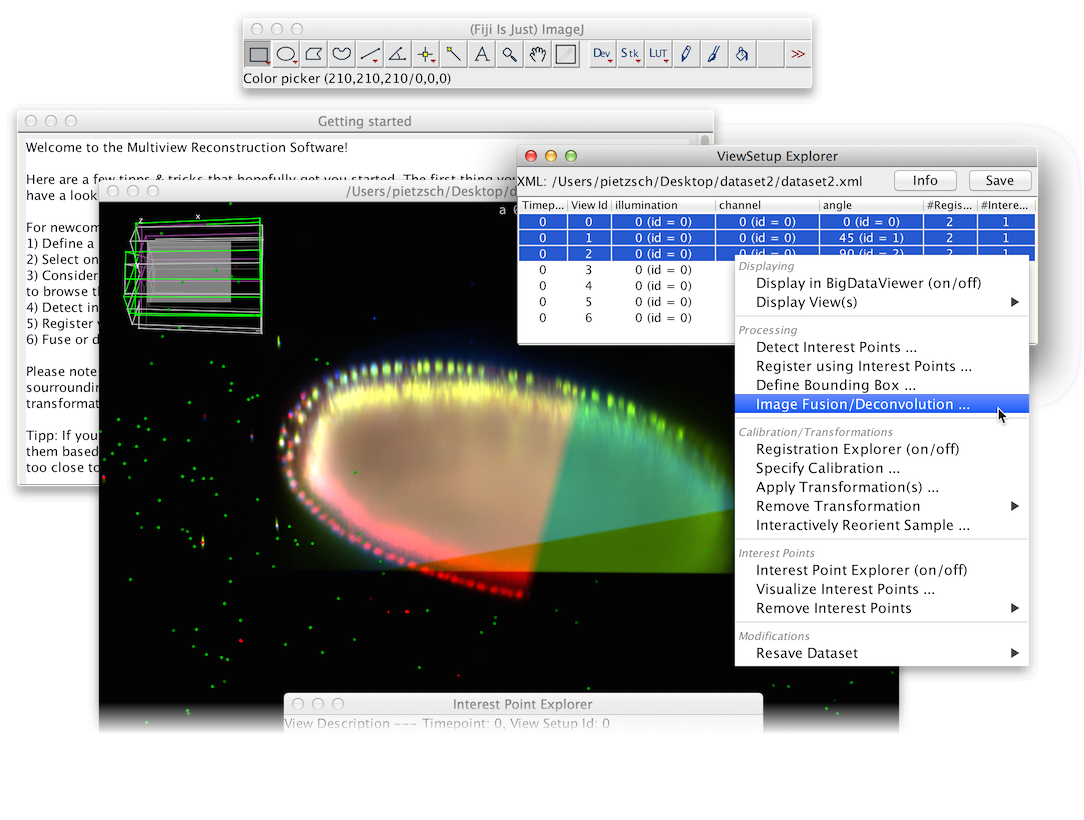
| MultiView Reconstruction | A tool for registration, fusion, deconvolution, and visualization of multiview microscopy images. |
|
 |
Interactive Analysis Plugins based on ‘Big Data’ Visualization Tools
Here we summarize the more advanced analysis plugins in ImageJ using the above ‘big data’ visualization tools.
| Plugin Name | Short Description | More Details... | Plugin Snapshot |
|---|---|---|---|
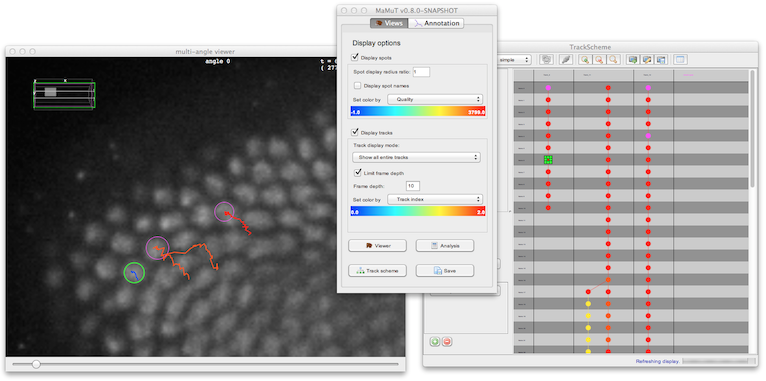
| MaMuT (Massive Multi-view Tracker) | A tool for manual and semi-automatic tracking in multiple views. |
|
 |
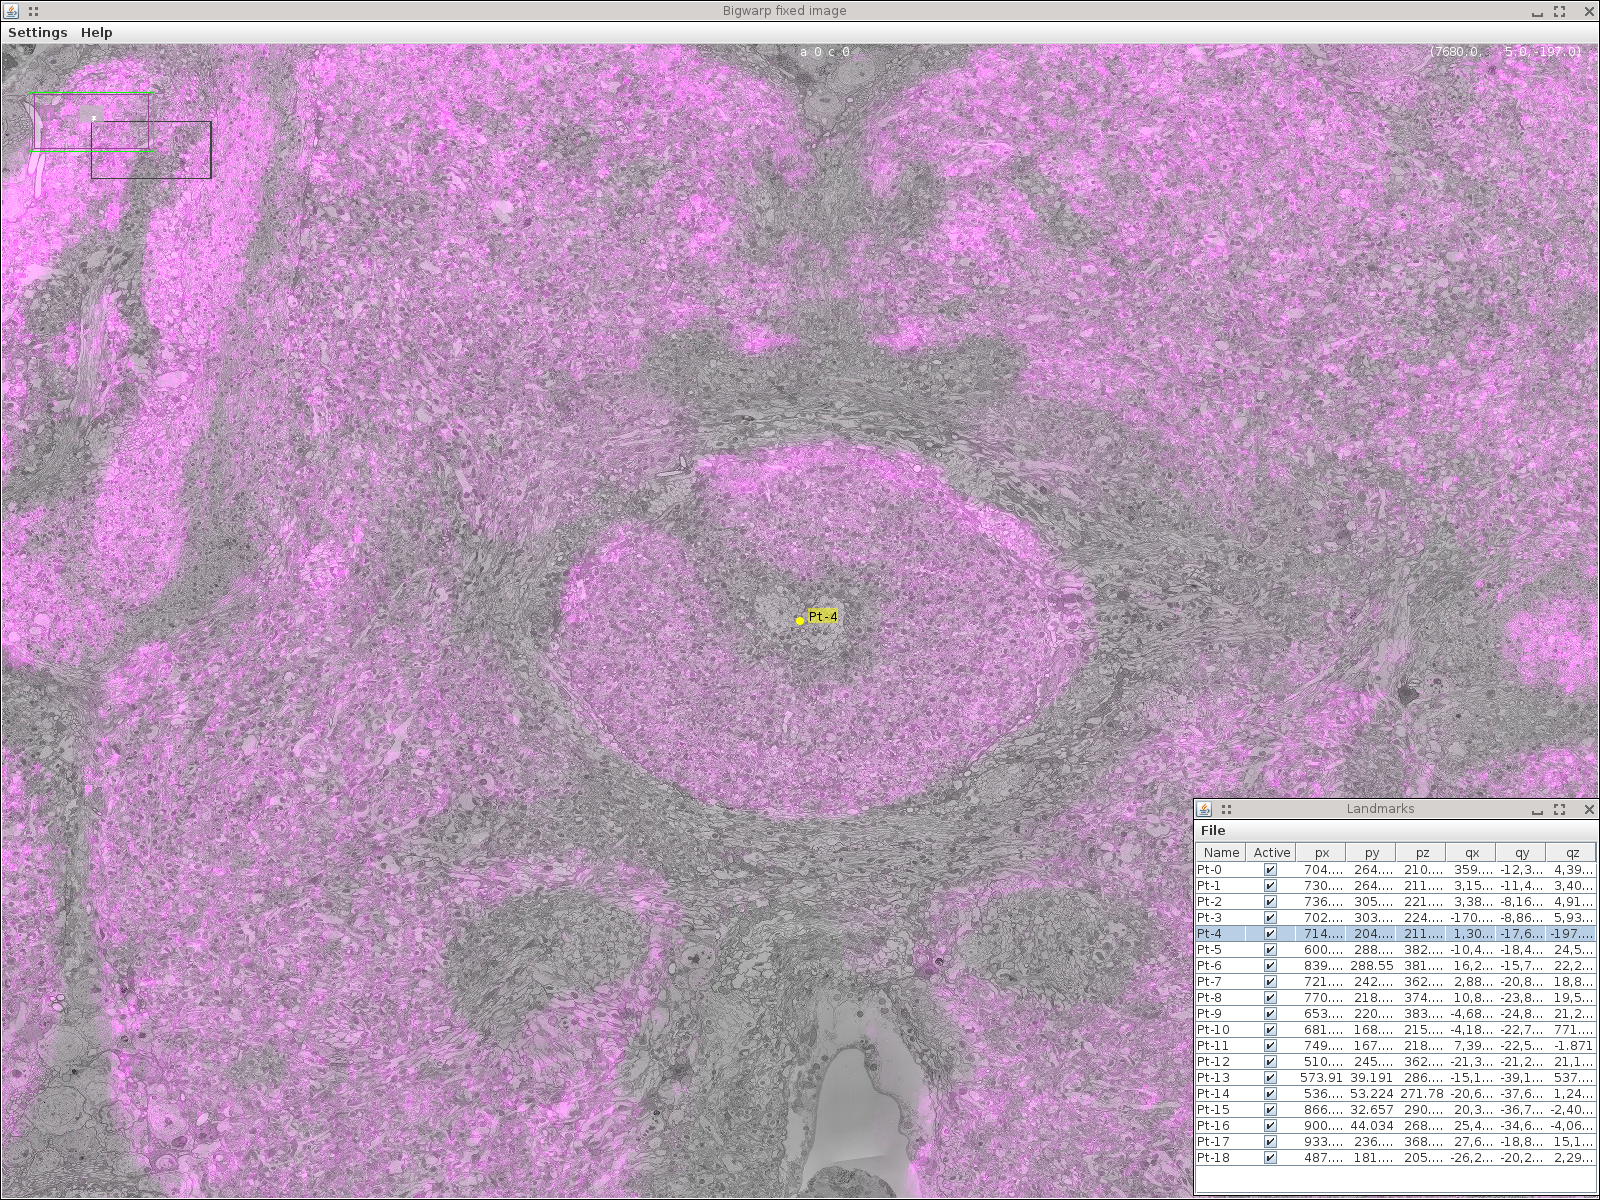
| BigWarp | A tool for manual, interactive, landmark-based deformable image alignment. |
|
 |
[1] http://peterkovesi.com/projects/colourmaps/
[2] http://www.kennethmoreland.com/color-maps/