Suppose you are given some images by a colleague, or have some images of your own, and you suspect that they may have been damaged by compression artifacts or brightness/contrast adjustment. Worse, you may have some images that you suspect might have been captured in such a way that information was missed or lost at the image capture stage due to bad detector settings. How can you detect these problems in an image?
Lets open a sample image and check it out:
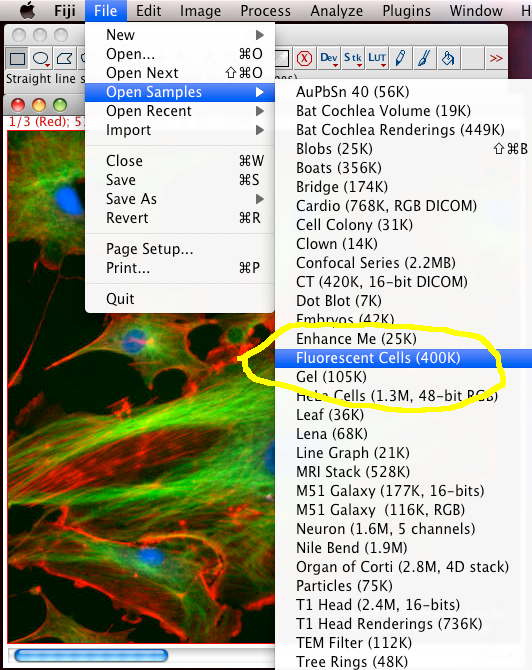
In Fiji, do “File - Open Sample Images - FluorescentCells.tiff, to open a three colour channel “pretty” image of some fixed and stained cells grown on glass. Click the image then press “i” to see info about the image. The slider under the image is to change between the three colour channels, and you can see the colour of the border and the writing at the top of the image in the information bar change colour accordingly (the meta data of which channel is what colour was stored in the tiff file, but your images may or may not have that meta data!)
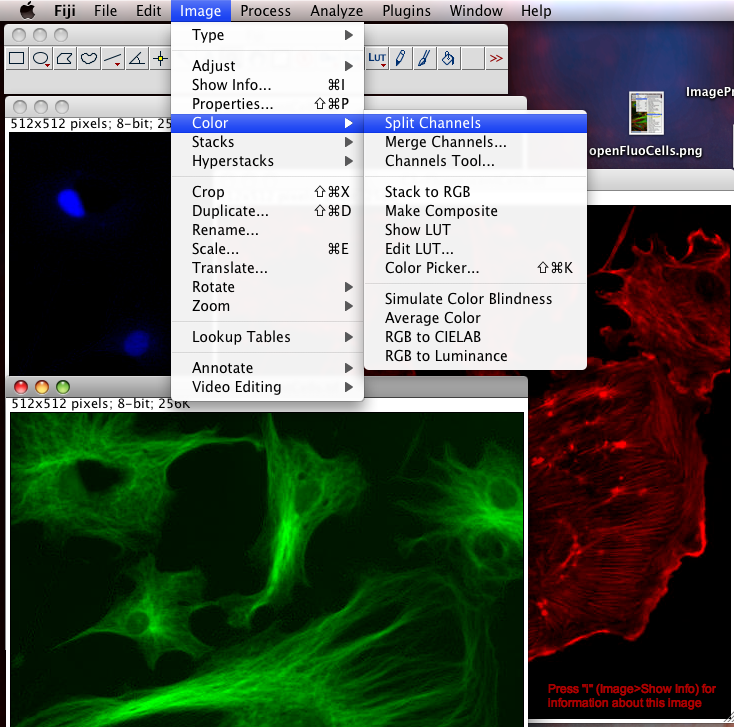
To Begin with, we should split the three color channel images into separate windows so we can inspect them and manipulate them separately: Select the FluorescentCells.tif image window and do menu item: “Image-Color-Split Channels”.
Lossy data compression
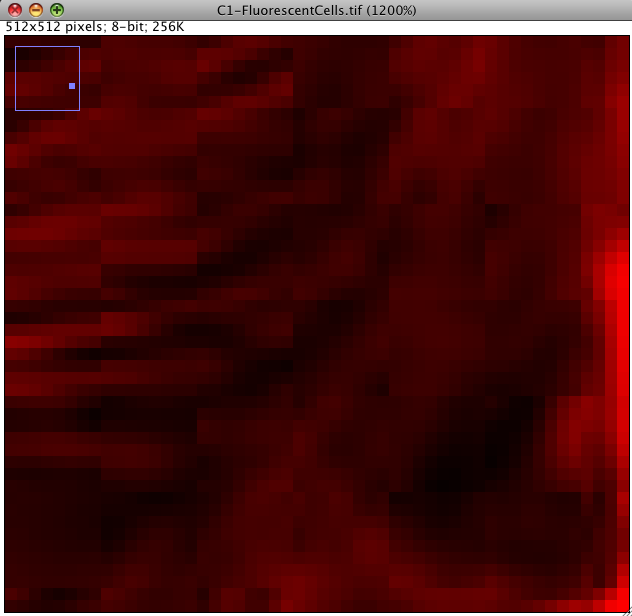
First, we can interrogate the red or green channel, and see if there are any lossy compression artifacts visible by eye: Click the magnifying glass icon in the Fiji main window and left click to zoom in to an area of interest (left click zooms in, right click zooms out again).
You should see something like the image below. Can you see that there are square shaped artifacts in the image which are 8x8 pixels? These are lossy JPEG compression artifacts. The image intensity data is messed up… so you would not want to quantify intensity data from an image like that. Some areas have been given all the same intensity (which is unlikely to be true) and some have ugly repetitive patterns, which are clearly false. Never use lossy JPEG or other lossy compression to store scientific data. Lossy compression is good for making movies etc smaller in file size, but bad for measurements afterwards. Images in PDF files of published research articles are usually lossy compressed, so its hard or impossible to repeat the image processing they did because the image data is messed up. This is a big problem in scientific publication in biological sciences, and we need to fix it: We need an online image database where data is published for others to down load and analyse, as is required by scientific publishing in other fields, eg x-ray crystallography for protein 3D structure and DNA/genome etc. sequencing. I don’t know why biological imaging thinks its so special…
Intensity Saturation or Clipping or Over Exposure
Next we can have a look to see of the image has been acquired or manipulated in such a way that the highest intensity information has been lost, due to detector CCD, PMT, etc. saturation / over exposure, such that the intensity scale of the information is clipped off at the top, like a mountain with the peak removed… so you can’t tell how high it was.
The easiest way to detect intensity saturation is to look at the intensity distribution histogram of the image. This is simply a histogram showing how many pixels in the image have which intensity. If there are too many pixels (or even any!) pixels that have an intensity value at the maximum of the scale, then there is lost intensity information. For an 8 bit scale image, which has intensity values from 0 to 255, the pixels with a value of 255 might really be 255, or they might all have different higher values, like 450, or 11,345 but you have no way of knowing. The information is LOST, and gone FOREVER. No amount of clever image processing can really get it back :-(
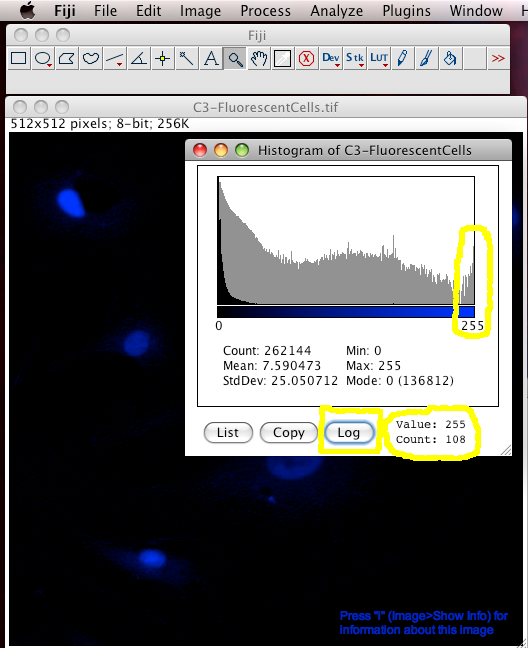
To make an intensity histogram from an image, in the Fiji menus select “Analyze-Histogram”. Then click the “Log” button in the histogram window to see the histogram in logarithmic scale (this is handy for fluorescence images that are often mostly black). You can see in the last “bin” (the 255 intensity bin) that there are 108 pixels that have intensity of 255… but are they really 255 or more than that… you have no idea. Worse still, it is often true that you are most interested in the brightest objects… but these are the ones that the true intensity information has been lost for :-O
Incorrect Detector Offset
This is a problem that occurs during image acquisition. The electronics that convert the signal that the detector produces when photons hit it must be turned into a number. This is usually an integer (whole number) from 0-255 (8bit) or 0-4095 (12 bit) or some larger scale (14 or even 16 or 32 bit). The electronics don’t know by default what signal from the detector is equivalent to zero photons hitting the detector, so the user has to tell the electronics that. This setting is called the detector offset. This is how you set zero photons from the sample to zero intensity in the digital image. If you get this offset wrong, either of 2 things happen: The offset could be too high or too low. If the offset is too high, then the image has a constant non zero background where it should be zero. That means zero signal is not zero in the image, but some number above zero. In this case if you try to measure intensity, the number is wrong since you need to first subtract the value of that non zero background. After the background subtraction, the intensity values are now more likely to be linearly proportional to the amount of light that hit the detector. In the other situation, where the offset was too low, you clipped off the lower intensity values that the detector could actually see for the darker pixels, to all zero in the image. That’s lost information again :-(
Where offset is too high, you are wasting the dynamic range of your detector. Where offset is too low, you have clipped off the lower intensities (which are usually not interesting, but they might be sometimes) and lost information. In both cases the intensity of the digital image is not as close to linear proportionality with the amount of light hitting the detector as it could be. That is obviously bad for image quantification since it’s the main assumption (which is usually not as true as you think it is, but thats another long story).
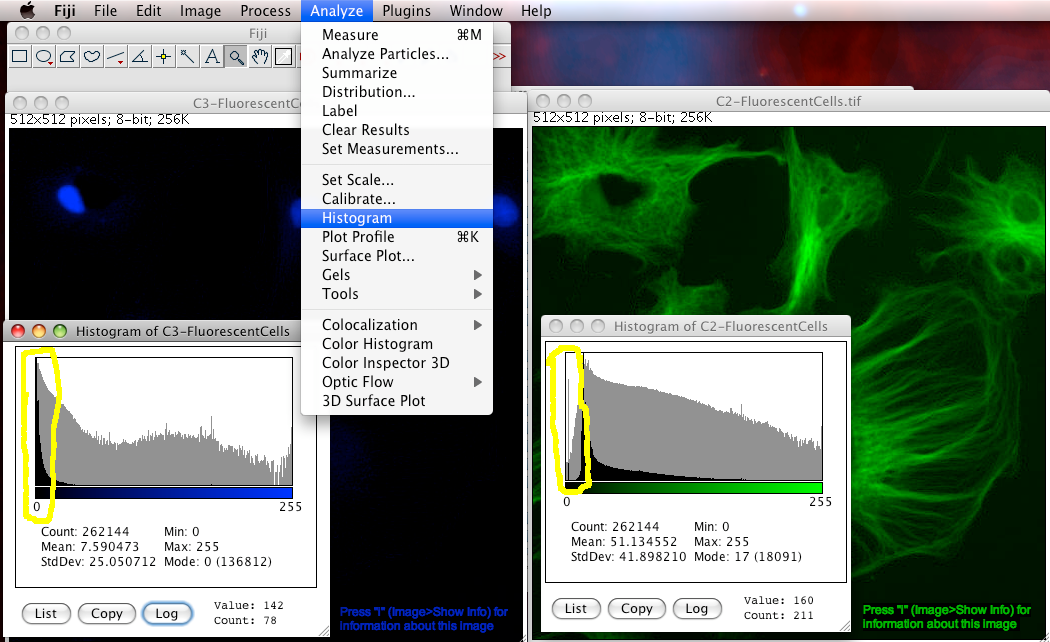
How can you tell if there is an offset problem in an image? Simply look at the intensity histogram (“Analyze-Histogram”). In the too high offset case look for empty or very small numbers in the low end of the intensity scale. That means there are no or too few pixels with values close to zero. See the green channel of FluorescentCells.tif for an example of that, look at the image below. For the too low offset case, there is no easy way to tell if that happened. Getting the detector offset wrong makes quantitative analysis very difficult or impossible, for instance in the case of auto thresholding a 2 channel image for Colocalization Analysis.
Questions you should ask before quantifying information from images:
- Q) Has there been lossy compression?
- Q) Is the intensity information saturated / clipped / overexposed?
- Q) Is there a problem with uniform background / detector offset?