The content of this page has not been vetted since shifting away from MediaWiki. If you’d like to help, check out the how to help guide!
Examples in Jython.
Open the “Plugins - Scripting - Jython Interpreter” (see Scripting Help) and make sure there is a TrakEM2 project open, with a display open. Then type or paste the examples below.
Or open a new Script Editor window with “File - New - Script”, then paste the example, select the “Language - Python”, and push the “Run” button.
Introduction to scripting TrakEM2
Some basics:
- The canvas into which images are dragged and visualized is part of a Display object. The latter has methods to access its Selection, as well as the Layer and LayerSet that the Display is viewing.
- The Layer contains 2D objects like Patch (each Patch wraps an image) and DLabel (floating text).
- The LayerSet contains 3D objects like AreaList, Pipe, Polyline, Ball, Dissector, Treeline and Stack (the latter wraps an ij.ImagePlus that contains an ij.ImageStack).
Both Layer and LayerSet are in a way containers. The LayerSet contains as well a list of Layer. The Display merely views the data in a LayerSet, one Layer at a time.
See a TrakEM2 class diagram for a complete list.
See also the complete TrakEM2 API documentation
To run a script, follow instructions as indicated in the Scripting Help.
Get the instance of a selected image
>>> p = Display.getFront().getActive()
>>> print p
    090504_0314_ex0768.mrc z=0.0 #67398
Obtain the ImagePlus of a selected image
>>> p = Display.getFront().getActive()
>>> imp = p.getImagePlus()
>>> print imp.width, imp.height
    2048 2048
Access the Layer and Selection of a Display
The ‘front’ is the last activated display window. If there’s only one display window, then that is ‘front’. To access the front display, we call static function getFront() in namespace Display:
>>> front = Display.getFront()
>>> layer = front.getLayer()
>>> layer_set = front.getLayerSet()
>>> sel = front.getSelection()
>>> print sel.getSelected().size()
    10
    >>> print sel.isEmpty()
    0
In Jython, 1 is True and 0 is False
The most interesting data members of a Display, as seen above, are mainly the Layer and the Selection.
Lock all selected objects
for d in Display.getFront().getSelected():
  d.setLocked(True)
Obtain a collection of selected images
The Selection object of a Display can return a number of collections with any selected objects in it, for example of type Patch (those that wrap an image). All you need to do is to call getSelected</i with the name of the class to filter for:
for d in Display.getSelected(Patch):
  print d.title
The above is a static call that retrieves the list for whichever Display window happens to be activated, in front of all others. If you have a Display instance, perform the same operation via the Display’s Selection:
front = Display.getFront()
selection = front.getSelection()
for d in selection.get(Patch):
  print d.title
Find the file path of images that lay under a specific floating text label
The idea is to add floating text labels over images (using the Text Tool), and then to search for all the images that are under the X,Y coordinate of each label. Then we print the
regularExpression = ".*fold.*"

for layer in Display.getFront().getLayerSet().getLayers():
  for label in layer.getDisplayables(DLabel):
    if label.getTitle().matches(regularExpression):
      tx = label.getAffineTransform().getTranslationX()
      ty = label.getAffineTransform().getTranslationY()
      patches = layer.find(Patch, tx, ty)
      for patch in patches:
        print patch.getImageFilePath()
Setting and getting member objects in jython
In Jython as in Python, member objects have automatically get and set functions.
For example, although a Displayable has a private String title member, this is valid python code for getting and setting the title of a Displayable like a Patch:
>>> p = Display.getFront().getActive()
>>> print p.title
    090504_0314_ex0768.mrc
Above, a Patch takes as title the name of the file containing the ImagePlus, by default. Let’s change the title to something else:
>>> p = Display.getFront().getActive()
>>> p.title = "A new name for this Patch"
>>> print p.title
A new name for this Patch
The properties of a Displayable: title, color, visibility, locked, alpha, affine transform, dimensions and bounds
Let’s set a few values:
>>> p = Display.getFront().getActive()
>>> p.title = "Test image"
>>> p.alpha = 0.4
>>> p.visible = True
>>> p.locked = False
>>> from java.awt import Color
>>> p.color = Color.blue
Tell all displays to update the canvas, so we see the changes:
>>> Display.repaint()
Let’s read a few values:
>>> p.getAffineTransform()
AffineTransform[[1.0, 0.0, 474.0], [0.0, 1.0, 567.0]]
>>> print p.getBoundingBox()
java.awt.Rectangle[x=474,y=567,width=2048,height=2048]
The affine transform cannot be set, because it’s a final member. But itself the value may be edited via setAffineTransform:
>>> from java.awt.geom import AffineTransform
>>> aff = AffineTransform()
>>> aff.scale(2.0, 2.0)
>>> p.setAffineTransform(aff)
>>> p.updateBucket()
Be careful: java’s AffineTranform does concatenations and not pre-concatenations (order matters in matrix multiplication).
In most occasions, what you want can be accomplished with preTransform</i, such as translating an image:
>>> from java.awt.geom import AffineTransform
>>> aff = AffineTransform()
>>> aff.translate(300, -400)
>>> p.preTransform(aff, True)
More convenient are the methods scale, translate, rotate and particularly preTransform, for the manipulation of a Displayable’s affine transform (see AffineTransform) and that of its linked Displayables (any transform propagates to the linked ones).
If you change the affine transform of a Displayable directly (by calling getAffineTransform() and then manipulating it), keep in mind that you will most likely screw up the internal cached maps for fast location of the Displayable object. To solve that, be sure to call updateBucket() on the affected Displayable object.
Import images, montage them, blend them and save as .xml
What follows is a small script that imports images from a single folder, sorting out which images go to what layer (section) by matching a regular expression pattern on the file name.
Then the images are montaged layer-wise, and blended together (the borders of the overlapping images are faded out).
Notice that, for this script to work for you, you will have to edit two lines:
- The source
folderwhere images are to be found. - The
patternto match, which dictates which image goes to which layer.
Be sure as well to create as many layers as you need. If you don’t know, use the getLayer method on the layerset variable, which has the ability to create a new layer when asked to get one for a Z for which a layer doesn’t exist yet.
Documentation you may want to look at: Project.newFSProject, [https://fiji.sc/javadoc/ini/trakem2/display/Patch.html#createPatch(ini.trakem2.Project,%20java.lang.String) Patch.createPatch], [<https://fiji.sc/javadoc/ini/trakem2/display/Layer.html#add(ini.trakem2.display.Displayable) Layer.add], Align, AlignTask,
# Albert Cardona 2011-06-05
# Script for Colenso Speer

import os, re

#folder = "/path/to/folder/with/all/images/"
folder = "/home/albert/Desktop/t2/example-data/images/2043_5_6_7"

# 1. Create a TrakEM2 project
project = Project.newFSProject("blank", None, folder)
# OR: get the first open project
# project = Project.getProjects().get(0)

layerset = project.getRootLayerSet()

#  2. Create 10 layers (or as many as you need)
for i in range(10):
  layerset.getLayer(i, 1, True)

# ... and update the LayerTree:
project.getLayerTree().updateList(layerset)
# ... and the display slider
Display.updateLayerScroller(layerset)

# 3. To each layer, add images that have "_zN_" in the name
#     where N is the index of the layer
#     and also end with ".tif"
filenames = os.listdir(folder)
for i,layer in enumerate(layerset.getLayers()):
  # EDIT the following pattern to match the filename of the images
  # that must be inserted into section at index i:
  pattern = re.compile(".*_z" + str(i) + "_.*\.tif")
  for filename in filter(pattern.match, filenames):
    filepath = os.path.join(folder, filename)
    patch = Patch.createPatch(project, filepath)
    layer.add(patch)
  # Update internal quadtree of the layer
  layer.recreateBuckets()

# 4. Montage each layer independently
from mpicbg.trakem2.align import Align, AlignTask
param = Align.ParamOptimize()  # which extends Align.Param
param.sift.maxOctaveSize = 512
#  ... above, adjust other parameters as necessary
# See:
#    features: https://fiji.sc/javadoc/mpicbg/trakem2/align/Align.Param.html
#    transformation models: https://fiji.sc/javadoc/mpicbg/trakem2/align/Align.ParamOptimize.html
#    sift: https://fiji.sc/javadoc/mpicbg/imagefeatures/FloatArray2DSIFT.Param.html
AlignTask.montageLayers(param, layerset.getLayers(), False, False, False, False)

# 5. Resize width and height of the world to fit the montages
layerset.setMinimumDimensions()

# 6. Blend images of each layer
Blending.blendLayerWise(layerset.getLayers(), True, None)

# 7. Save the project
project.saveAs(os.path.join(folder, "montages.xml"), False)

print "Done!"
Manipulating Displayable objects
Resetting the affine transform of all images in a Layer
Suppose you open the project and find that the images of a Layer have non-rigid affine transforms, and you’d like to remove the non-rigid part. A reasonable approach is to reset their affine transforms to identity, and then translate them to approximately where they used to be (based on their bounding box):
layer = Display.getFront().getLayer()

# Get all selected images
# patches = Display.getFront().getSelection().getSelected(Patch)

# Get all images in the current layer
patches = layer.getDisplayables(Patch)

for patch in patches:
  bounds = patch.getBoundingBox()
  patch.getAffineTransform().setToIdentity()
  patch.translate(bounds.x, bounds.y, False)

Display.repaint()
Save the above into a file named “reset_affine_transforms.py” under plugins directory or subdirectory to run it directly from the menus, or copy-paste it into the Jython Interpreter.
See also: the different methods for manipulating the affine transform of a Displayable object like a Patch.
And a WARNING: if you modify the AffineTransform of a Patch and don’t call then any of the Displayable methods for doing so as well (like we did above: the script calls “Displayable.translate”), then you must update the bucket yourself:
patch.updateBucket()
The bucket is the region of the 2D world where the Patch lives. Picture the world as a checkerboard, where a given image, wrapped in a Patch object, belongs to each of the square that it intersects. Failing to update the bucket will result in improper canvas repaints–the Patch cannot be found.
Adding areas to an AreaList by scanning pixel values in the slices of a stack
The script below is the same as the command “Import - Import labels as arealists”.
from ini.trakem2 import Project
from ini.trakem2.utils import AreaUtils
from ini.trakem2.display import AreaList
from java.awt import Color

# Obtain an image stack
#imp = IJ.getImage()
imp = WindowManager.getImage("0_5_filtered.tif")

# Obtain the opened TrakEM2 project
p = Project.getProjects()[0]

# Obtain the LayerSet
layerset = p.getRootLayerSet()

# Create a new AreaList, named "synapses"
ali = AreaList(p, "synapses", 0, 0)

# Add the AreaList to the datastructures:
layerset.add(ali)
p.getProjectTree().insertSegmentations([ali])

# Obtain the image stack
stack = imp.getImageStack()

# Iterate every slice of the stack
for i in range(1, imp.getNSlices() +1):
  ip = stack.getProcessor(i) # 1-based
  # Extract all areas (except background) into a map of value vs. java.awt.geom.Area
  m = AreaUtils.extractAreas(ip)
  # Report progress
  print i, ":", len(m)
  # Get the Layer instance at the corresponding index
  layer = layerset.getLayers().get(i-1) # 0-based
  # Add the first Area instance to the AreaList at the proper Layer
  ali.addArea(layer.getId(), m.values().iterator().next())

# Change the color of the AreaList
ali.setColor(Color.magenta)

# Ensure bounds are as constrained as possible
ali.calculateBoundingBox(None)

Display.repaint()
Extract areas from an arealist and put them as ROIs in ImageJ’s ROI Manager
# Albert Cardona 2012-06-19
# Obtain an arealist and add all its areas as ROIs in the ROI Manager

from ini.trakem2.display import Display, AreaList
from ij.gui import ShapeRoi
from ij.plugin.frame import RoiManager

def getRoiManager():
  ** Obtain a valid instance of the ROI Manager.
  Notice that it could still be null if its window is closed.**
  if RoiManager.getInstance() is None:
    RoiManager()
  return RoiManager.getInstance()

def putAreas(arealist):
  ** Take all areas of an AreaList and put them in the ROI Manager.**
  for layer in arealist.getLayerRange():
    area = arealist.getAreaAt(layer)
    if area is not None and not area.isEmpty():
      roi = ShapeRoi(area)
      getRoiManager().addRoi(roi)

def run():
  front = Display.getFront()
  layers = front.getLayerSet().getLayers()
  arealists = front.getSelection().getSelected(AreaList)
  if arealists.isEmpty():
    IJ.log("No arealists selected!")
    return
  # Extract areas as ROIs for the first one:
  putAreas(arealists[0])

run()
Notice that python (and jython) lets you use object instance methods as first-class functions, and constructors as well. This enables us to rewrite the “putAreas” function in a functional way, without using any temporary variables and without any if/else logic:
def putAreas(arealist):
  ** Take all areas of an AreaList and put them in the ROI Manager.**
  def put(arealist):
  map(getRoiManager().addRoi,
      map(ShapeRoi,
          filter(lambda area: not area.isEmpty(),
                 filter(None,
                        map(arealist.getAreaAt, arealist.getLayerRange())))))
Adding images
Adding a single image to a layer shown in an open display
# Obtain a pointer to the frontmost open display:
front = Display.getFront()
# Open an image
filepath = "/path/to/image.tif"
imp = IJ.openImage(filepath)
# Create a new Patch, which wraps an image
patch = Patch(front.project, imp.title, 0, 0, imp)
patch.project.loader.addedPatchFrom(filepath, patch)
# Add it to a layer
front.layer.add(patch)
Copying images between two open projects
The script checks that at least two displays are open, and that they belong to two different projects. Then offers a dialog to choose the direction of copying, and finally copies all images, or all visible or selected images, from one project to the other:
# Albert Cardona 20100201
# Script to copy all images, all visible images, or all selected images
# from a source layer to a target layer.
# To run the script, put it under Fiji plugins folder or subfolder and call "Plugins - Scripting - Update Fiji"
# and make sure you have at least two projects open, each with at least one display open.
#
# Written for Natalya at Graham Knott's group, EPFL

from ini.trakem2.display import *
from ij.gui import GenericDialog
from ij import IJ
from array import array


def run():
    # Check precondition: at least some displays open
    displays = Display.getDisplays()
    if displays.isEmpty():
        IJ.showMessage("Could not find any TrakEM2 displays open!")
        return
    # Check precondition: at least two displays from two different projects
    projects = {}
    for display in displays:
        projects[display.project] = display
    if len(projects) < 2:
        IJ.showMessage("You need at least two projects with at least one display open for each!")
        return
    # Show choices
    gd = GenericDialog("Copying images between projects")
    titles = array(String, [display.getFrame().getTitle() for display in displays])
    gd.addChoice("Source layer:", titles, titles[0])
    gd.addChoice("Target layer:", titles, titles[1])
    choices = ["All images", "All visible images", "All selected images"]
    gd.addChoice("Copy:", choices, choices[0])
    gd.showDialog()
    if gd.wasCanceled():
        return
    source = displays[gd.getNextChoiceIndex()]
    target = displays[gd.getNextChoiceIndex()]
    if source == target:
        IJ.showMessage("You must choose different source and target layers!")
        return
    copy_mode = gd.getNextChoiceIndex()
    patches = None
    if 0 == copy_mode:
        patches = source.getLayer().getDisplayables(Patch)
    elif 1 == copy_mode:
        patches = source.getLayer().getDisplayables(Patch, True)
    else:
        patches = source.getSelection().getSelected(Patch)
    if 0 == len(patches):
        IJ.showMessage("No images to copy with option: " + choices[copy_mode])
        return
    # Copy images
    for patch in patches:
        p = patch.clone(target.project, False)
        target.getLayer().add(p)
    target.getLayerSet().enlargeToFit(patches)
    IJ.showStatus("Done copying images between layers.")

run()
To create a script with the above code, copy paste it into a file with an underscore in its name and extension “.py”. Then place it in Fiji’s plugins folder or subfolder thereof. Finally, restart Fiji or just call “Plugins - Scripting - Refresh Jython Scripts”.
Concatenating multiple project XML files by copying all their layers
# Albert Cardona 2010-06-30 for JC Rah
# Takes a list of project XML files
# and grabs all layers in order
# and clones each and all its images
# and then adds it to a newly created project named "all_layers.xml"


from ini.trakem2 import Project
from ini.trakem2.display import Patch
from ini.trakem2.utils import Utils
from ij import IJ


source_dir = "/path/to/projects/" # MUST have ending slash
project_paths = ["project1.xml", "project2.xml", "project3.xml"]

# folder to save the target project at
target_folder = source_dir

def merge_layers():
  # Create a new project target_folder as the storage folder:
  target = Project.newFSProject("blank", None, target_folder)
  # Save it there as "all_layers.xml" so we can call "save()" on it later
  target.saveAs(target_folder + "all_layers.xml", True)
  targetlayerset = target.getRootLayerSet()
  z = 0
  # For each project to concatenate, open it, and:
  for path in project_paths:
    IJ.log("Processing project " + path)
    project = Project.openFSProject(source_dir + path, False)
    rectangle = project.getRootLayerSet().get2DBounds()
    # For each layer in the project, create a new layer "targetlayer" to host a copy of its images:
    for layer in project.getRootLayerSet().getLayers():
      targetlayer = targetlayerset.getLayer(z, 1, True)
      z += 1
      # Add to the new layer copies of each image
      for ob in layer.getDisplayables():
        targetlayer.add(ob.clone(target, False)) # clone in the context of the target project
    project.getLoader().setChanged(False) # avoid dialog at closing
    project.destroy()
    targetlayerset.setMinimumDimensions()
  # Regenerate all image mipmaps
  futures = []
  for patch in targetlayerset.getDisplayables(Patch):
    futures.append(patch.updateMipMaps())
  Utils.wait(futures)
  target.save() # to validate mipmaps
  #target.destroy()  # comment out to close it
  IJ.log("Done!")

# Invoke the function!
merge_layers()
Measure
Measure the minimal distance from each ball to a surface defined by a profile list
Suppose for example that, using a Ball object, you have clicked on each vesicle of a synaptic terminal. And that, using a profile list, you have traced the surface area of a synapse.
|
style="vertical-align:top" | 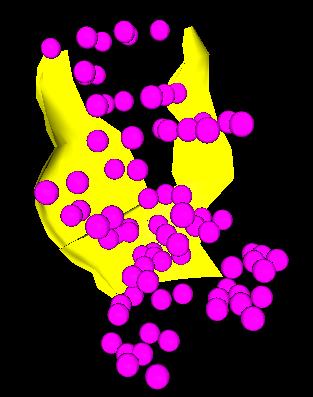 313|3D view of a synaptic surface and its vesicles
|
style="vertical-align:top" | 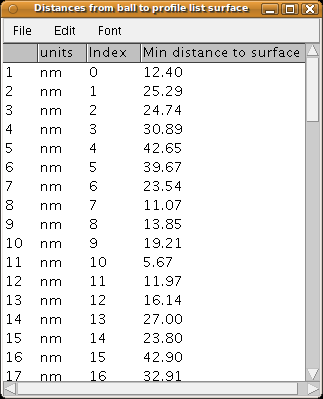 323|Synaptic vesicle measurements of the minimal distance from each vesicle to the synaptic surface
|
Using the following script, we generate a surface from the profile list, and then measure, for each synaptic vesicle, its minimal distance to the synaptic surface.
The results are finally listed in a results table, from which column-ordered data may be exported for further processing in a spreadsheet.
# Albert Cardona 20100201
# Select a Ball and a Profile, and list the minimal distances of each ball
# to the nearest vertex of the mesh created by the profile list to which
# the profile belongs.
#
# As asked by Graham Knott and Natalya, from EPFL


from ini.trakem2.display import Display, Ball, Profile
from ini.trakem2.utils import M, Utils
from ij import IJ
from ij.measure import ResultsTable
from ij.gui import GenericDialog
from java.util import HashSet


def run():
	sel = Display.getSelected()
	# Check conditions: one Ball and one Profile only must be selected
	if sel is None or sel.isEmpty():
		IJ.log("Please select a Ball and a Profile!")
		return
	c = [ob.getClass() for ob in sel]
	if Ball in c and Profile in c and 2 == sel.size():
		pass
	else:
		IJ.log("Please select just one Ball and one Profile")
		return
	obs = {}
	for ob in sel:
		obs[ob.getClass()] = ob
	balls = obs[Ball].getWorldBalls()
	profile = obs[Profile]
	profiles = []
	# Gather triangles from profile mesh (into a HashSet to remove the many duplicate vertices)
	verts = HashSet(Profile.generateTriangles(profile.project.findProjectThing(profile).getParent(), 1))
	# Prepare a results table
	rt = ResultsTable()
	rt.setPrecision(2)
	rt.setHeading(0, "Index")
	rt.setHeading(1, "Min distance to surface")
	# Fill data rows
	unit = profile.layer.parent.calibration.unit
	i = 0
	count = len(balls)
	for i in range(count):
		rt.incrementCounter();
		rt.addLabel("units", unit)
		rt.addValue(0, i)
		b = balls[i]
		# For each ball, measure the minimal distance to any of the triangle vertices.
		rt.addValue(1, Math.sqrt(reduce(Math.min, [M.distanceSq(b[0], b[1], b[2], vert.x, vert.y, vert.z) for vert in verts])))
		Utils.showProgress(float(i)/count)
	rt.show("Distances from ball to profile list surface")
	# Reset progress bar
	Utils.showProgress(1)

run()
A similar measurement may be obtained like the following, if you don’t mind typing in the IDs of the Ball (vesicles) and AreaList (the synaptic surface), and getting the results summarized into mean, standard deviation and median (of the distances of each vesicle to the mesh):
# The IDs of the Ball and AreaList instances
vesiclesID = 1543
synapticSurfaceID = 1541

# Obtain the two TrakEM2 instances
project = Project.getProjects()[0]
vesicles = project.findById(vesiclesID)
synapticSurface = project.findById(synapticSurfaceID)

# A set of unique vertices defining the synaptic surface
vertices = set(synapticSurface.generateTriangles(1, 2))

# For every vesicle, measure its shortest distance to a vertex
distances = [reduce(min, map(lambda v: p.distance(v), vertices))
			 for p in vesicles.asWorldPoints()]

# Compute average, median and standard deviation
mean = sum(distances) / len(distances)
stdDev = Math.sqrt(reduce(lambda s, e: s + pow(e - mean, 2),
						  distances, 0)) / len(distances)
median = sorted(distances)[len(distances)/2]

print mean, stdDev, median
Interacting with Layers (Sections)
Calibrating and setting the Z dimension
Each Layer stores a Z coordinate and a thickness value with double precision. The Z coordinate is in pixels.
How to compute the Z coordinate of a Layer: suppose that the calibration specifies 4x4x50 nm. This means 4 nm/px in the X axis, 4 nm/px in the Y axis, and 50 nm/px in the Z axis. It is assumed that you set this values by right-clicking on the canvas window and choosing “Display - Calibration…”, which opens the familiar ImageJ dialog for image calibration.
Then you have to compute the thickness of a section relative to X axis coordinates. To do so:
layer thickness = (Z calibrated thickness) / (X calibrated thickness)
In our example of 4x4x50 nm/px:
layer thickness = 50 / 4 = 12.5
Then we must set this thickness to every section. This consists of the following steps to be done on the Layer Tree This is the tree that lists the layers in the TrakEM2 window):
- Right-click on the “Top Level [Layer Set]” node of the Layer Tree.
` Then choose “Reset layer Z and thickness”.`
- Click on the first layer node, then ⇧ Shift +
 Left Click on the last layer node.
` All nodes will be selected.`
- Right-click on the selected nodes and choose “Scale…”. 4. In the dialog, type in “12.5”–the value we computed above.
To accomplish the same programatically, do the following:
z = 0
thickness = 12.5
# Obtain the LayerSet instance:
layerset = Display.getFront().getLayerSet()
#
for layer in layerset.getLayers():
  layer.setZ(z)
  layer.setThickness(thickness)
  z += thickness

# Update the GUI
layerset.getProject().getLayerTree().updateUILater()
Interacting with Treeline, AreaTree and Connector
All three types: “treeline”, “areatree”, and “connector” are expressed by homonimous classes that inherit from the abstract class ini.trakem2.display.Tree.
A Tree is a Displayable and hence presents properties such as title, alpha, color, locked, visible … which are accessible with their homonimous set and get methods (e.g. setAlpha(0.8f);, getAlpha(); etc.)
The Tree consists of a root Node and public methods to access it and modify it.
The root Node gives access to the rest of the nodes of the Tree. From the canvas, a user would push ‘r’ on a selected Treeline, AreaTree or Connector to bring the field of view to where the root node is. From code, we would call:
# Acquire a reference the selected object in the Display
t = Display.getFront().getActive()
# If t is not a Tree, the following will fail:
root = t.getRoot()
Now that we have a reference to the root Node, we’ll ask it to give us the entire collection of subtree nodes: all nodes in the Tree:
nodes = root.getSubtreeNodes()
The NodeCollection is lazy and doesn’t do caching. If you are planning on calling size() on it, and then iterating its nodes, you would end up iterating the whole sequence twice. So let’s start by duplicating it:
nodes = [nd for nd in nodes]
Each Node has:
- X, Y coordinates, relative to the local coordinate system of the Tree that contains the Node.
- A reference to a layer (get it with nd.getLayer()). The Layer has a getZ() method to get the Z coordinate (in pixels).
- A data field, which can be a radius or a java.awt.geom.Area (see below).
Each Node contains a getData() public method to acquire whatever it is that it has:
- Treeline and Connector: its nodes getData() return a radius. The default value is zero.
- AreaTree: its nodes getData() return a java.awt.geom.Area instance, or null if none yet assigned to it.
Obtaining the X,Y,Z coordinates of all nodes in a Tree
Here is how to iterate over all the node’s X,Y,Z positions, in world coordinates:
from ini.trakem2.display import Display
from jarray import array

def getNodeCoordinates(tree):
  ** Returns a map of Node instances vs. their X,Y,Z world coordinates. **
  root = tree.getRoot()
  if root is None:
	return {}
  calibration = tree.getLayerSet().getCalibration()
  affine = tree.getAffineTransform()
  coords = {}
  #
  for nd in root.getSubtreeNodes():
	fp = array([nd.getX(), nd.getY()], 'f')
	affine.transform(fp, 0, fp, 0, 1)
	x = fp[0] * calibration.pixelWidth
	y = fp[1] * calibration.pixelHeight
	z = nd.getLayer().getZ() * calibration.pixelWidth   # a TrakEM2 oddity
	# data may be a radius or a java.awt.geom.Area
	coords[nd] = [x, y, z]
  #
  return coords

# Obtain the tree selected in the canvas:
tree = Display.getFront().getActive()

# Print all its node coordinates:
for node, coord in getNodeCoordinates(tree).iteritems():
  x, y, z = coord
  print "Coords for node", node, " : ", x, y, z
Sorting nodes by their tags
from ini.trakem2.display import Display

def sortNodesByTags(tree):
  table = {}
  root = tree.getRoot()
  if root is None:
	return table # empty
  #
  for nd in tree.getRoot().getSubtreeNodes():
	tags = nd.getTags()
	if tags is None:
	  continue
	for tag in tags:
	  tagged = None
	  if table.has_key(tag):
		tagged = table[tag]
	  else:
		tagged = []
		table[tag] = tagged
	  tagged.append(nd)
  #
  return table

# Obtain the currently selected Tree in the canvas:
tree = Display.getFront().getActive()

# Print the number of nodes that have any given tag:
for tag, tagged in sortNodesByTags(tree).iteritems():
  print "Nodes for tag '" + str(tag) + "':", len(tagged)
Compute the betweenness centrality of every node
The centrality is the measure of how important is a node in tree, according to how many times any possible pair of nodes is linked by a path that passes through that node.
The method we use is Ulrik Brande’s fast algorithm for computing betweenness centrality (see the paper).
The method computeCentrality() of class Tree returns as a Map of Node instance vs. its centrality value:
from ini.trakem2.display import Display

# Obtain the currently selected Tree in the canvas:
tree = Display.getFront().getActive()

# Compute betweenness centrality
bc = tree.computeCentrality()   # a java.util.Map

# Print the value for each node
for e in bc.entrySet():
  print e.getKey(), "=>", e.getValue()
We may then use the centrality to colorize the tree with a heat map: the higher the centrality value, the more intense the yellow color; the lower, the more intense the blue color:
from ini.trakem2.display import Display
from java.awt import Color

def computeColor(centrality, highest):
  red = centrality / float(highest)
  blue = 1 - red
  return Color(red, red, blue)

# Obtain the currently selected Tree in the canvas:
tree = Display.getFront().getActive()

# Compute betweenness centrality
bc = tree.computeCentrality()   # a java.util.Map

# Find out the maximum centrality value, to scale:
maximum = reduce(max, bc.values())

# Colorize each node according to its centrality
for e in bc.entrySet():
  node = e.getKey()
  centrality = e.getValue()
  node.setColor(computeColor(centrality, maximum))

# Update display
Display.repaint()

# Show the tree in the 3D Viewer
Display3D.show(tree.getProject().findProjectThing(tree))
Compute the degree of every node
The degree of a node is the number of parent nodes that separate it from the root node. It’s a built-in function in Tree (and also in Node):
In the following example, we colorize the tree based on the degree of the node: the closer to the root, the hotest:
from ini.trakem2.display import Display
from java.awt import Color

def computeColor(degree, highest):
  blue = degree / float(highest)
  red = 1 - blue
  return Color(red, red, blue)

# Obtain the currently selected Tree in the canvas:
tree = Display.getFront().getActive()

# Compute betweenness centrality
degrees = tree.computeAllDegrees()   # a java.util.Map

# Find out the maximum degree value, to scale:
maximum = reduce(max, degrees.values())

# Colorize each node according to its degree:
for e in degrees.entrySet():
  node = e.getKey()
  degree = e.getValue()
  node.setColor(computeColor(degree, maximum))

# Update display
Display.repaint()

# Show the tree in the 3D Viewer
Display3D.show(tree.getProject().findProjectThing(tree))
Find branch nodes or end nodes
The Tree class offers methods to obtain the list of all branch points, end points, or both:
from ini.trakem2.display import Display

# Obtain the currently selected treeline or areatree or connector:
tree = Display.getFront().getActive()

# A collection of all end nodes (not lazy):
endNodes = tree.getEndNodes()

# A lazy collection of all branch nodes:
branchNodes = tree.getBranchNodes()

# A lazy collection of both all end nodes and all branch nodes:
endOrBranchNodes = tree.getBranchAndEndNodes()
Remember that these lazy collections are non-caching. If you call size() on it, it will traverse the whole tree of nodes just to find out how many nodes of that kind exist.
If you want to sort out all nodes in one pass, query the number of children that each node has:
- if 0, it’s an end node
- if 1, it’s a slab node
- if more than 1, it’s a branch node
from ini.trakem2.display import Display

# Obtain the currently selected treeline or areatree or connector:
tree = Display.getFront().getActive()

endNodes = []
branchNodes = []
rest = []

for nd in tree.getRoot().getSubtreeNodes():
  count = nd.getChildrenCount()
  if 1 == count:
	rest.append(nd)
  elif 0 == count:
	endNodes.append(nd)
  else:
	branchNodes.append(nd)

print "Found:"
print "end nodes:", len(endNodes)
print "branch nodes:", len(branchNodes)
print "slab nodes:", len(rest)
Keep in mind that the root node will be listed among the nodes above, so it’s not counted as an end node (unless it doesn’t have any children, e.g. when the tree consists of only the root node).
Find out at which nodes the tree is connected to other trees, via Connector
The idea here is to iterate all nodes of a tree, and determine, for each node, whether it is enclosed by the origin point of a Connector instance. Then, we query that connector for its target objects. In the end, we obtain a table of nodes vs. lists of objects that node is connected to:
from ini.trakem2.display import Display, Connector
from jarray import array
from java.awt.geom import Area
from java.awt import Rectangle

# Obtain the currently selected treeline or areatree:
tree = Display.getFront().getActive()
affine = tree.getAffineTransform()
layerset = tree.getLayerSet()

# Maps of nd vs list of trees:
outgoing = {}   # e.g. presynaptic to some trees

for nd in tree.getRoot().getSubtreeNodes():
  # Obtain the node position in world coordinates
  fp = array([nd.getX(), nd.getY()], 'f')
  affine.transform(fp, 0, fp, 0, 1)
  x = int(fp[0])
  y = int(fp[1])
  # Query the LayerSet for Connector objects that intersect it
  cs = layerset.findZDisplayables(Connector, nd.getLayer(), x, y, False)
  if cs.isEmpty():
	continue
  # Else, get the target Tree instances that each connector links to:
  targets = []
  area = Area(Rectangle(x, y, 1, 1))
  for connector in cs:
	if connector.intersectsOrigin(area):
	  for target in connector.getTargets(Tree):
		targets.append(target)
  if len(targets) > 0:
	outgoing[nd] = targets

# print the map of nodes and the number of trees each connects to:
for node, targets in outgoing.iteritems():
  print node, " connects to", len(targets)
Similarly, we could compute the incomming connections. There is a convenience method findConnectors() in class Tree to return two lists: that of the outgoing and that of the incomming Connector instances. From these, one can easily get the connectivity graph, which you may also get by right-clicking on a Display and going for “Export - Connectivity graph…”.
How to find out the network of all arbors, related via Connector instances
The easiest way is to iterate all connectors and find out which objects they are relating. A Connector object has an origin (the root node) and any number of targets (all children nodes of the root node). Each node has a radius; any other object in the TrakEM2 project that intersects with the world coordinates of that radius will be considered associated as an origin or a target.
from ini.trakem2.display import Display, Connector, Tree

layerset = Display.getFront().getLayerSet()

# table of relationships: one source vs. its list of targets
graph = {}

for connector in layerset.getZDisplayables(Connector):
  targets = []
  for targetSet in connector.getTargets(Tree):
	for target in targetSet:
	  targets.append(target)
  for origin in connector.getOrigins(Tree):
	ls = None
	if graph.has_key(origin):
	  graph[origin] += targets
	else:
	  graph[origin] = targets

# print the graph (we print the id of each object):
for origin,targets in graph.iteritems():
  tids = ""
  for target in targets:
	tids += str(target.id) + ", "
  print origin.id, "=>", tids
Notice how about we called getOrigins(Tree) and getTargets(Tree), which filters all potential origins and targets (Patch–an image–, AreaList, etc.) so that only Tree instances will be present in the lists.
NOTE: you may also want to use the “Export - NeuroML” menu command, in the right-click popup menu.
Measure all spine necks in a neuronal arbor
UPDATE: as of version 0.8n, this functionality is included in TrakEM2. Right-click on a selected treeline or areatree and choose “Measure - Shortest distances between all pairs of nodes tagged as…”
The idea is to label the beginning of a spine neck with the tag “neck start” and the end of the spine neck with the tag “neck end”. It is assumed that the “next end” will always be in the subtree of the “neck start” node; in other words, that the direction of the tree is from “neck start” to “neck end”.
Then, we iterate all nodes of the arbor looking for nodes that have the “neck start” tag and measure the calibrated length of the neck. All measurements for all spine necks are printed out.
# 2011-03-13 Albert Cardona for Nuno da Costa
#
# For a given Treeline or AreaTree that represents a neuronal arbor,
# find all nodes that contain the tag "neck start"
# and for each of those find the distance to a node
# in their subtree that contains the tag "neck end".
#
# In short, measure the lengths of all spine necks
# labeled as such in the arbor.


from math import sqrt
from ini.trakem2.display import Display, AreaTree, Treeline

def findNeck(startNode):
  ** Assumes necks are not branched. **
  neck = []
  for node in startNode.getSubtreeNodes():
	tags = getTagsAsStrings(node)
	if tags is None or not "neck end" in tags:
	  neck.append(node) # growing the neck
	  continue
	# Else, end of neck:
	neck.append(node)
	return neck
  print "Did not find a node with an end tag, for parent node " + startNode
  return None # end tag not found!


def getTagsAsStrings(node):
  found = set()
  tags = node.getTags()
  if tags is None or 0 == len(tags):
	return found
  for tag in tags:
	found.add(tag.toString())
  return found


def measureSpineNecks(neuron):
  ** Expects an AreaTree or a Treeline for neuron.
  Assumes that nodes with a tag "neck start" are parents or superparents of nodes with tags of "neck end".
  **
  print "Measurements for neuron '" + str(neuron) + "':"
  for node in neuron.getRoot().getSubtreeNodes():
	# Check if the node has the start tag
	tags = getTagsAsStrings(node)
	if tags is None or not "neck start" in tags:
	  continue
	# Find its child node that has an end tag
	neck = findNeck(node)
	if neck is None:
	  continue
	distance = neuron.measurePathDistance(neck[0], neck[-1])
	print "  id:", neuron.getId(), "-- neck length: ", distance


def isTree(x):
  return isinstance(x, Treeline) or isinstance(x, AreaTree)


# Measure in all treelines or areatrees:
#trees = filter(isTree, Display.getFront().getLayerSet().getZDisplayables())

# Measure only in the selected treelines or areatrees:
trees = filter(isTree, Display.getSelected())

if 0 == len(trees):
  print "No trees found!"
else:
  for neuron in trees:
	measureSpineNecks(neuron)
Interact with a Ball object
Set the radius of all balls of all Ball objects in a project
##############
# Set a specific radius to all individual spheres
# of all Ball objects of a TrakEM2 project.


calibrated_radius = 40  # in microns, nm, whatever


display = Display.getFront()
layerset = display.getLayerSet()
cal = layerset.getCalibration()
# bring radius to pixels
new_radius = calibrated_radius / cal.pixelWidth

for ballOb in layerset.getZDisplayables(Ball):
  for i in range(ballOb.getCount()):
	ballOb.setRadius(i, new_radius)
  ballOb.repaint(True, None)
##############
Export all Ball objects as a CSV file
# Open a text window containing all Ball objects as a CSV file,
# in calibrated coordinates.
# The text window has a "File - Save" menu for saving to a file.

# Albert Cardona 2015-07-02 for Jemima Burden at UCL.

# See also the API of the Ball class:
# https://github.com/trakem2/trakem2/blob/-/src/main/java/ini/trakem2/display/Ball.java#L716


from ini.trakem2.display import Display, Ball
from ij.text import TextWindow

ball_obs = Display.getFront().getLayerSet().getZDisplayables(Ball)

# One entry for each id,x,y,z,r
rows = []

# Iterate every Ball instance, which contains one or more x,y,z,r balls
for ball_ob in ball_obs:
  id = ball_ob.getId()
  # Iterate every x,y,z,r ball of a Ball instance, calibrated
  wbs = ball_ob.getWorldBalls()
  for ball_coords in wbs:
	# Store every ball as a row with id, x, y, z, r
	rows.append(str(id) + "," + ",".join(str(c) for c in ball_coords))

csv = "\n".join(rows)

t = TextWindow("Balls CSV", csv, 400, 400)
Generate 3D meshes
In TrakEM2, 3D meshes are generated as a list of Point3f for each object. Then the list is wrapped into any of the subclasses of CustomMesh of the 3D Viewer library, such as a CustomTriangleMesh or a CustomLineMesh. Then these mesh objects are encapsulated into a Content object and added to an instance of the Image3DUniverse, which is the main window of the 3D Viewer.
Of course, via scripting many of these steps may be skipped. Below are several examples on how to generate meshes programmatically and save them in Wavefront format.
Generate a 3D mesh for an AreaList
This script illustrates how to bypass the 3D Viewer to generate meshes from an AreaList and then export the data in Wavefront format. The script exports an AreaList that has been selected in the front Display.
To export all selected objects, loop through the Display.getSelected().
To export all arealists, loop through Display.getFront().getLayerSet().getZDisplayables(AreaList).
from ini.trakem2.display import Display
from org.scijava.vecmath import Color3f
from customnode import WavefrontExporter, CustomTriangleMesh
from java.io import StringWriter
from ij.text import TextWindow

# Get the selected AreaList
arealist = Display.getSelected()[0]

# Create the triangle mesh with resample of 1 (no resampling)
# CAUTION: may take a long time. Try first with a resampling of at least 10.
resample = 1
triangles = arealist.generateTriangles(1, resample)

# Prepare a 3D Viewer object to provide interpretation
color = Color3f(1.0, 1.0, 0.0)
transparency = 0.0
mesh = CustomTriangleMesh(triangles, color, transparency)

# Write the mesh as Wavefront
name = "arealist-" + str(arealist.id)
m = {name : mesh}
meshData = StringWriter()
materialData = StringWriter()
materialFileName = name + ".mtl"
WavefrontExporter.save(m, materialFileName, meshData, materialData)

# Show the text of the files in a window
# then you save it with "File - Save"
TextWindow(".obj", meshData.toString(), 400, 400)
TextWindow(materialFileName, materialData.toString(), 400, 400)
Generate a 3D mesh for an AreaTree
Just like for an AreaList (see above), but extract the triangles with:
triangles = areatree.generateMesh(1, resample).verts
The AreaTree’s generateMesh returns a MeshData object with the list of vertices and the list of colors of each vertex. The generateTriangles method of an AreaTree returns a list of Point3f that are ready for creating a CustomLineMesh (in PAIRWISE mode) to represent the skeleton.
Save the project while running a task
While a task is running, the right-click menu shows only an entry to cancel the task. To save the project while the task is running, type the following into the Jython Interpreter, and push return to execute it:
Display.getFront().getProject().save()
If you would like to edit the Project properties, the following code will open the “Project - Properties…” dialog:
Display.getFront().getProject().adjustProperties()
In the above dialog, you will be able to set the autosaving interval (see the bottom text field of the dialog that opens). The interval defaults to zero (meaning never). Set it for example to 30 (once every half hour).
Of course it may be easier to set that autosaving interval before running the long task!
Create a TrakEM2 project for fast visualization, without mipmaps
Create a TrakEM2 project that avoids generating mipmaps, then import lots of images from a text file that has four columns: the file path, the X, the Y, and the section index of each image tile. Then acquire a snapshot of the first section.
As a result of the script, a new Project tab will open in the “/plugins/trakem2” window, and a new Display window will show. At any time, run “project.saveAs(xmlfilepath)” to store the project in an XML file, and from then on just “project.save()”. Or right-click and choose “Project - Save”, or push ‘s’.
# Albert Cardona 2011-02-02
# At Madison, Wisconsin, with Erwin Frise
from ini.trakem2 import Project
from ij.gui import Toolbar
from java.awt import Color
from ij import ImagePlus

project = Project.newFSProject("blank", None, "/home/albert/Desktop/t2/")
loader = project.getLoader()
loader.setMipMapsRegeneration(False) # disable mipmaps
layerset = project.getRootLayerSet()
layerset.setSnapshotsMode(1) # outlines

task = loader.importImages(
		  layerset.getLayers().get(0),  # the first layer
		  "/home/albert/Desktop/t2/example-data/images/list.txt", # the absolute file path to the text file with absolute image file paths
		  " ", # the column separator  <path> <x> <y> <section index>
		  1.0, # section thickness, defaults to 1
		  1.0, # calibration, defaults to 1
		  False, # whether to homogenize contrast, avoid
		  1.0) # scaling factor, default to 1

task.join() # Optional: wait until all images have been imported

# Export a snapshot of the layer at 25% magnification

scale = 0.25
layer = layerset.getLayers().get(0)
flat = loader.makeFlatImage(ImagePlus.COLOR_RGB, layer, layerset.get2DBounds(), scale, layer.getAll(Patch), Color.black)

imp = ImagePlus("snap " + str(scale), flat).show()

print "done!"
Create a snapshot in 8-bit, 16-bit, 32-bit or RGB
From the right-click menu, one may choose “Export - Make flat image”, which opens a dialog that lets one choose between 8-bit and RGB. These snapshots are created from the mipmaps, which are all 8-bit or RGB images.
On occasions, one wants to create a flattened montage of images in their original bit depth, such as 16-bit or 32-bit. For this purpose, the static function Patch.makeFlatImage exists.
Here is an example that, for a given Layer and set of selected Patch instances (image tiles) in it, it makes a 16-bit flat montage image and returns it as an ImageJ’s ImageProcessor, at 50% the original scale.
from ini.trakem2.display import Display, Patch
from java.awt import Color

front = Display.getFront() # the active TrakEM2 display window
layer = front.getLayer()
tiles = front.getSelection().get(Patch)  # selected Patch instances only
backgroundColor = Color.black
scale = 0.5

roi = tiles[0].getBoundingBox()
for tile in tiles[1:]:
  roi.add(tile.getBoundingBox())

print "Creating flat image from", len(tiles), "image tiles"

ip = Patch.makeFlatImage(
		   ImagePlus.GRAY16,
		   layer,
		   roi,
		   scale,
		   tiles,
		   backgroundColor,
		   True)  # use the min and max of each tile

imp = ImagePlus("Flat montage", ip)
imp.show()
For other output types, use ImagePlus.GRAY8, .GRAY16, GRAY32 or .COLOR_RGB, as listed in the documentation for the ImagePlus class.
Enrich the GUI of TrakEM
Add an extra tab to a Display
TrakEM API is accessible at all times. Here is an example that adds a new tab to the display. The new tab consists of a JPanel with a single button in it.
Notice that Jython lets you define the methods of event listeners as additional arguments to the constructor. So the JButton gets an actionPerformed method (from the ActionListener interface) just by referencing a declared method.
# Albert Cardona 2010-03-19 at EMBL
# Specially demo'ed for Larry Lindsey

def doSomething(evt):
  IJ.showMessage("Button pushed!")

def addReconstructToolkit(display):
  tabs = display.getTabbedPane()
  # Check that it's not there already
  title = "Reconstruct toolbar"
  for i in range(tabs.getTabCount()):
	if tabs.getTitleAt(i) == title:
	  IJ.showMessage("Reconstruct toolbar already in this Display!")
	  return
  # Otherwise, add it new:
  from javax.swing import JPanel, JButton
  pane = JPanel()
  b = JButton("Push it", actionPerformed=doSomething)
  pane.add(b)
  tabs.add(title, pane)


front = Display.getFront()
if front is not None:
  addReconstructToolkit(front)
else:
  IJ.showMessage("Open a display first!")
See also
TrakEM2 tutorials
- TrakEM2 how to, with java code examples.
- TrakEM2 video tutorials.
Jython scripting
- Jython Scripting in fiji.
- Jython webpage.
- Fiji scripting tutorial in Jython.
Jython scripts for TrakEM2
All the following are included in Fiji’s plugins/Examples/plugins/trakem2_Example_Scripts/ folder:
- Extract stack under AreaList in TrakEM2.
- Set all transforms to identity for TrakEM2 objects.
- Select All objects in TrakEM2.
- Measure AreaList in TrakEM2.
- A collection of scripts for TrakEM2, hosted by github. Mostly related to inspecting and analyzing Treeline, AreaTree and Connector instances, when used for neural circuit reconstruction.