The content of this page has not been vetted since shifting away from MediaWiki. If you’d like to help, check out the how to help guide!
Simple ImageJ/Fiji plugin to plot intensity of a spot over time.
Installation
To install this plugin check the “ValelabUtils” update site in the Fiji updater.
Usage
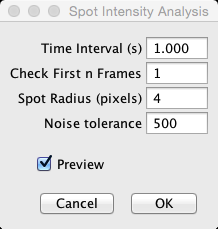
This plugin has two phases, in the first phase it detects spots. It does so by scanning for local maxima in the image with a box of user-defined size (“Spot radius (pixels)”). Local maxima are accepted when the maximum is higher than a user-defined number (“Noise tolerance”) over the average of the 4 corners of the box. An image constructed by averaging the first n images (“Check First n Frames”) is used for the spot finding. This same image is used to calculate the background (which is currently done using the ImageJ Background tool using a ball radius of 100 and “Sliding paraboloid” checked).
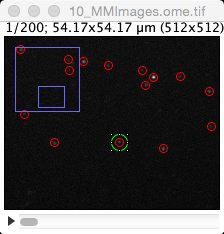
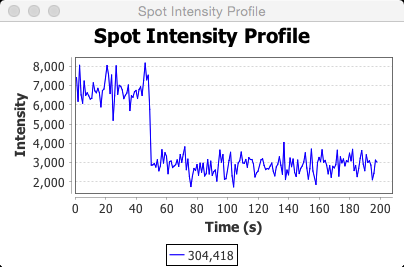
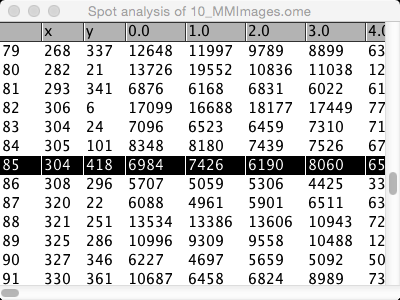
In the second phase the intensities of each spot at each time point is calculated. The Background image is first subtracted from each frame, and then the intensities of all pixels in a circle with given radius around the center (maximum) pixel is calculated. When selecting a row in the resulting table, a plot is generated with the intensities plotted as a function of time. Clicking in the image itself will select the nearest by spot, select the corresponding row in the table and draw the intensity plot. Data can be exported by selecting the table, followed by File › Save As in the menu. The first two columns in the output table are the x and y position of the spot (in pixels). The keyboard key “j” will scroll up, the key “k” will scroll down.
If there is significant movement during the time-lapse image, you will first need to “de-jitter” using another ImageJ plugin.
Testing
| To test the plugin, use the data: File › Open Samples › Tracks for TrackMate. Convert to 16 bit (Image | Type | 16-bit). In the Spot Intensity Analysis plugin set Time Interval to 1.0, Electrons per ADU to 1.0, Check First n Frames to 10, Spot Radius (pixels) to 3, Noise tolerance to 45, and Background estimation to Median-40. Press OK. You should get a table with 3 rows. Clicking on any of the rows in the table or the red circles in the image should bring up a graph with the intensity profile. |
Common Problems
When the plugin does not work on your stack, or if it only works on the first image, make sure that ImageJ sees your stack as a time-lapse and not as a Z-stack. To do so, go to Image › Properties…, and make sure that the number of Slices is 1, and the number of Frames is whatever the length of your stack. If that is not the case, change the numbers in the dialog.
History
- 2018-01-18 - Version 0.3. Updated to match changes in jfreechart library
- 2017-07-04 - Version 0.22. Use Gaussian blur to determine background rather than rolling ball. Use floats rather than longs in calculations to avoid clipping and negative values. Should result in better precision and better background estimate.