The content of this page has not been vetted since shifting away from MediaWiki. If you’d like to help, check out the how to help guide!
These are a set of plugins that are used to work with data in the frame direction. The F_Project plugin projects the images in the frame direction into a lower dimension using different methods. The F_Profiler pulgin plots the contents of an ROI through the frame direction. The Frame_Slider provides sliders to step though the frames of a hyperstacks based on the variable/values in the slice labels.
F_Project

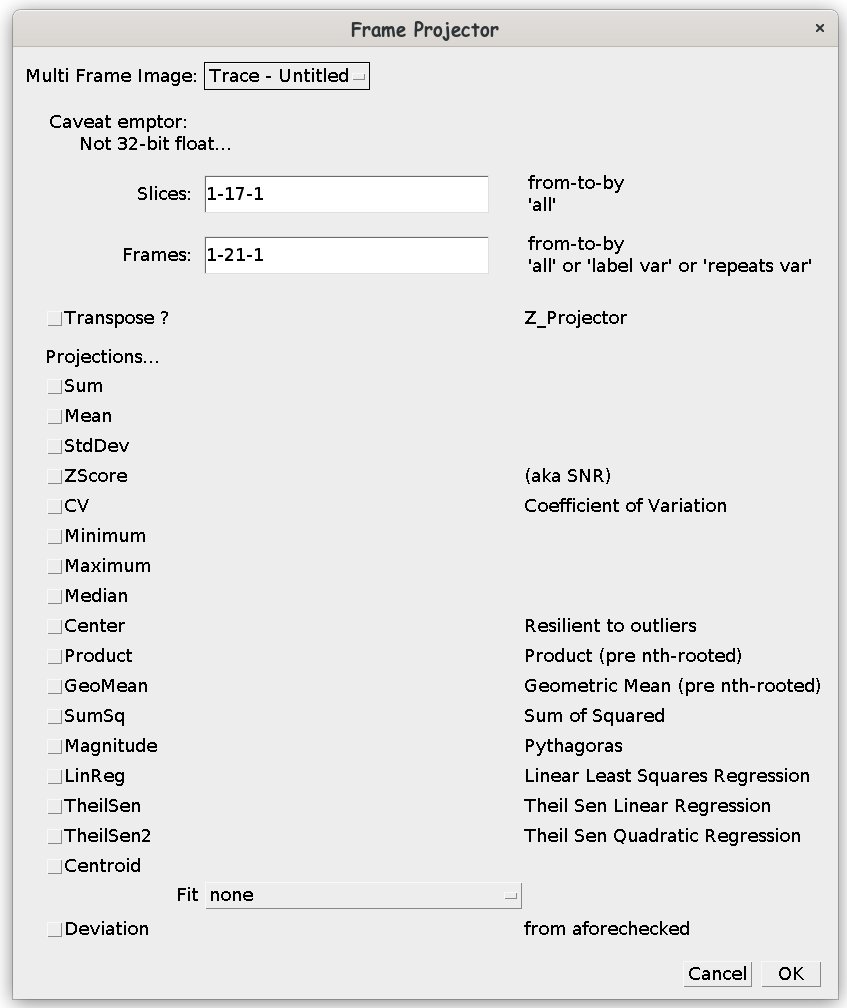
When run as a plugin from the gui the image used is identified on the top line. A subset of the slices and frames can be used as the source data; see syntax for Make Substacks…. When the identified frames is ‘label’, the frames are grouped by identical labels. When the frames are identified by ‘repeats var’, where var is the name of the variable in the slice label, these frames are treated as repeats of data.
Transpose? Swap frames for slices.
The following summary methods as provided:
Sum Arithmetic Sum
Mean Arithmetic Mean (μ)
StdDev Standard Deviation (σ) - computed using the slow method for numerical accuracy
ZScore Z Score (μ/σ) - akin to Signal to Noise (SNR)
CV Coefficient of Variation (σ/μ)
Minimum Minimum
Maximum Maximum
Median Median
Center Weighted arithmetic mean around the median - resilient to outliers
Product Product (Π si-n)n
GeoMean Geometric Mean - prescaled product (Π si-n)
SumSq Sum of Squares
Magnitude Pythagoras
LinReg Linear least squares regression - frames returned m, b, r2
TheilSen Theil Sen linear regression with Center estimator - frames m, b
Theilsen2 Theil Sen quadratic regression with with Center estimator - a,b,c
Centroid Centroid
Fit CurveFitter fitting - frames are model parameters, r2, Ψ2
Deviation Appends a frame with the appropriate deviation from an appropriate selected summary.
If the first slice of every frame has a Short Label that can be split by the regex “ = |=| “, e.g., var = fval, and the list has unique elements, the float fval values will be used in the fittings instead of the frame number.
There are also static methods provided, with the same names, albeit, all lower case, with two syntaxis: method(ImagePlus,slices,frames), method(ImagePlus), save fit(..., int), fit(..., String).
TreeMap<String,Double> getVars(ImagePlus imp, int f)
Extract variable/value pairs from frame’s slice label.
TreeMap<String,TreeMap<Double,Double>> getVars(ImagePlus imp)
Extract variable/values from all frames’ slice labels.
LinkedHashMap<String,String> overRepeats(ImagePlus imp, String var)
Determine the subsets (keys) that exist and the associated comma separated frames (values), where var is the repeater.
see ‘repeats var’
TreeMap<Double,String> sortFramesByLabel(ImagePlus imp)
returns comma separated list of frames for each unique label.
void removeVarFromLabels(ImagePlus imp, String var)
Remove superfluous variable var from all slice labels
void replaceVarValWithInLabel(ImagePlus imp, String var, String val)
Replace all the values for var with val in all the slice labels.
int findVarInLabel(ImagePlus imp, String var)
Determines position of var in the slice label variables. -1 not found or error.
TreeMap<Double,String> sortFramesByLabel(ImagePlus imp, String var)
Determine frames (values - comma separated) that corrosponds to each var values (keys).
ImagePlus extractFramesByVar(ImagePlus imp, String var, double val)
Extract all frames that have the variable / value pair var/val.
TreeMap<Double,ImagePlus> extractFramesByVar(ImagePlus imp, String var)
Extract the frames (as an ImagePlus) that corresponds to each value (key) for slice label
ImagePlus sortFramesByVar(ImagePlus imp, String var)
Rearrange frame order to that of increasing var values.
double center(double[] a)
weighted mean weighted to the median
double[] theilsen(double[] ... _x)
theilsen regressor for linear.
can be called as x[],y[] or xy[][] but only the first pair computed
double[] theilsen2(double[] ... _x)
theilsen regressor for quadradic.
can be called as x[],y[] or xy[][] but only the first pair computed
double[] linreg(double[] x, double[] y)
linear least squares regressor
can be called as x[],y[] or xy[][] but only the first pair computed
double centroid(double[] x, double[] y)
Centroid
public interface Compute {
public double[] compute(double[] x, double[] y);
   return (x == null) ? new double[NV] : process(x,y);
   }
ImagePlus compute(ImagePlus imp, Compute fp)
ImagePlus compute(ImagePlus imp, String slices, String frames, Compute fp)
ImagePlus compute(ImagePlus imp, Compute fp, ImagePlus mask)
ImagePlus compute(ImagePlus imp, String slices, String frames, Compute fp, ImagePlus mask)
ImagePlus[] split(ImagePlus imp)
fit and compute have ImagePlus[] method(..., ImagePlus[] imps);
imps is syntactic sugar. Nota bene: Works even when there is only one slice in the Z direction.
Uses
ASL - MRI
ImagePlus aslAcquired = . . .
ImagePlus tag = F_Project.mean(aslAcquired,"all","1-100-2");
ImagePlus ctl = F_Project.mean(aslAcquired,"all","2-100-2");
ImagePlus asl = ctl.duplicate();
(new ImageCaculator()).run("Subtract 32-bit stack", asl, tag);
(new ImageCaculator()).run("Divide 32-bit stack", asl, ctl);
ADC - MRI
/* Assuming many b-values (slicelabels = "b=%f") */
ImagePlus dwiAcquired = . . .
ImagePlus dwi = dwiAcquired.duplicate();
ImagePlus dwib0 = SubHyperstackMaker.makeSubhyperstack(dwi,"1-"+dwi.getNSlices(),"1",dwiAcquired);
for(int f=0; f<dwiAcquired.getNFrames(); f++)
   (new ImageCalculator()).run("Divide 32-bit stack", dwi, dwib0);
ImagePlus adc_etal = F_Project.fit(dwi,"Exponential");
OR with more resilience to outliers . . .
IJ.run(dwi, "Log", "");
ImagePlus adc_etal = F_Project.theilsen(dwi);
Arbitrary proccessing
IJ.run(mask,"Convert to Mask", "method=Huang background=Default calculate");
ImagePlus[] pimp = F_Project.compute(imp, new F_Project.Compute() {
   @Override
   public double[] compute(double[] x, double[] y) {
      if (x == null) return new double[10]
      return nonlinearFit(x,y);
      }
   }, mask, new ImagePlus[0]);
F_Profilier

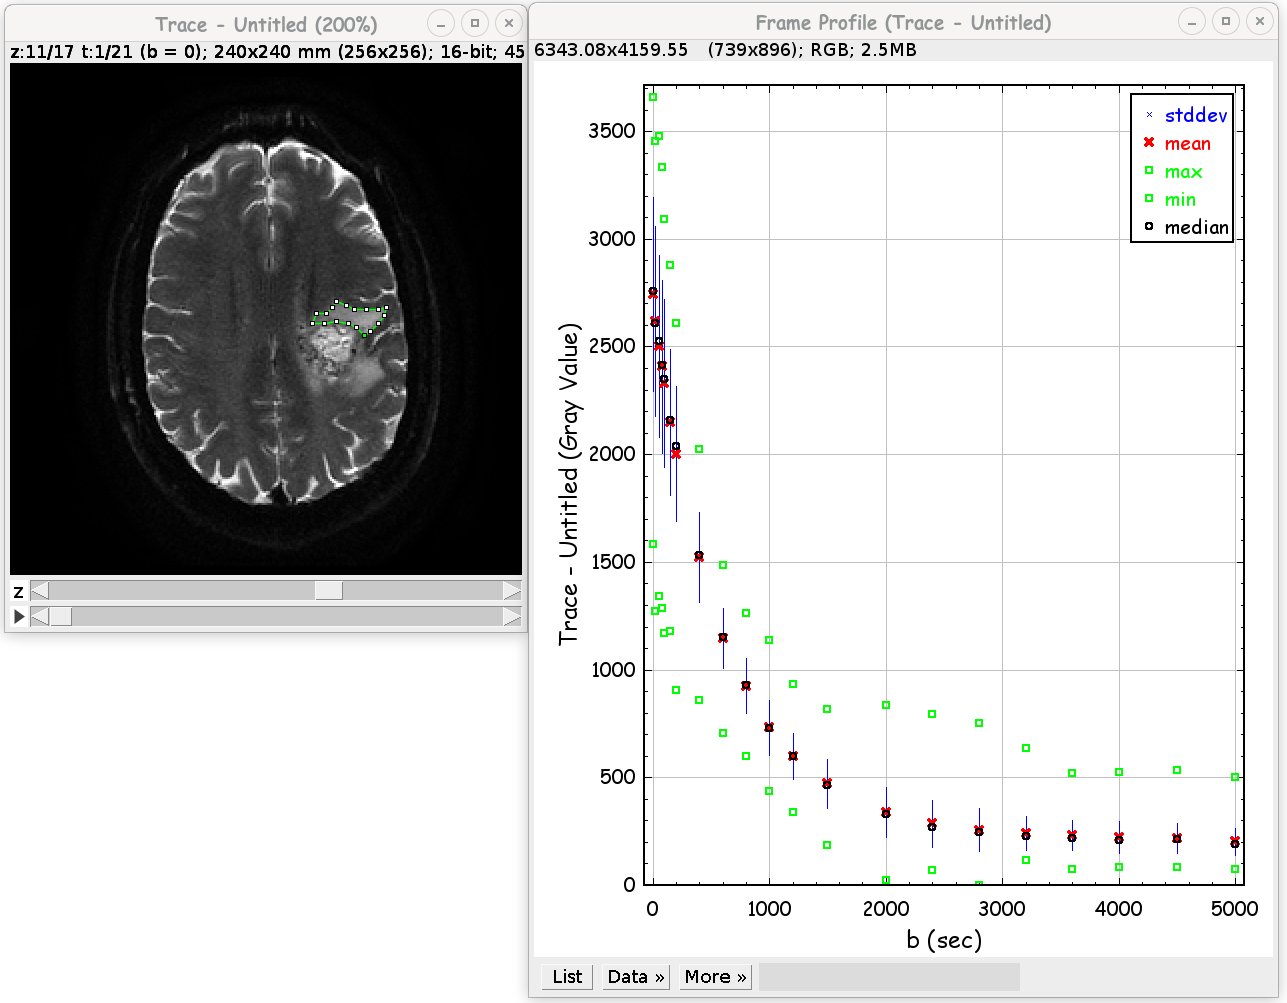
Given a Hyperstack image, draw an ROI and start plugin. Manipulate the ROI and the plot changes. Check out Interactive_Fitting plugin.
Frame_Slider

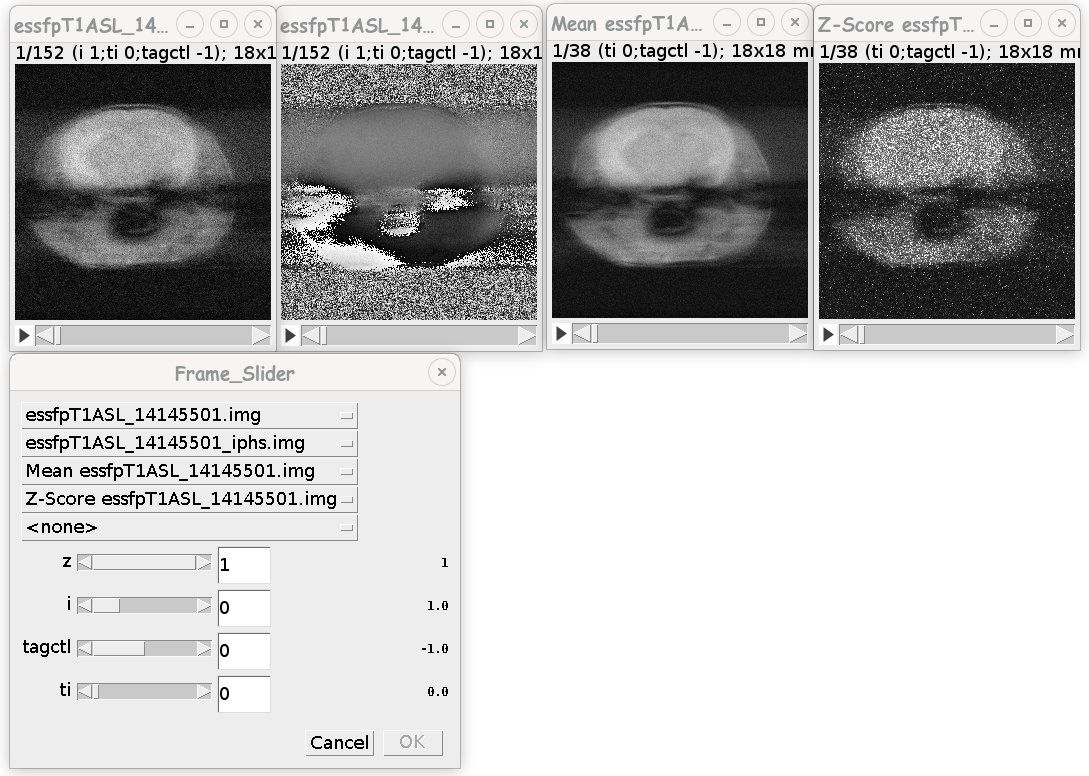
When you have one or more Hyperstacks open and want to step though the images per the variables in the slice labels, start the Frame_Slider with the dataset with the most variables, select the other datasets, and step through them using the sliders. The datasets should all be governed by the same set of variables, i.e., The two left images are the raw data with repeats and the two right images are the mean and SNR projections, to see why click the scrollbars.
Install
Unzip Frames.zip into ImageJ plugins File › Show Folder › Plugins or plugins/jars directories. Source code in jar file.
ChangeLog
- 1 April 2018 - Initial Version.
- 1 April 2019 - Updated.