The content of this page has not been vetted since shifting away from MediaWiki. If you’d like to help, check out the how to help guide!
Usage
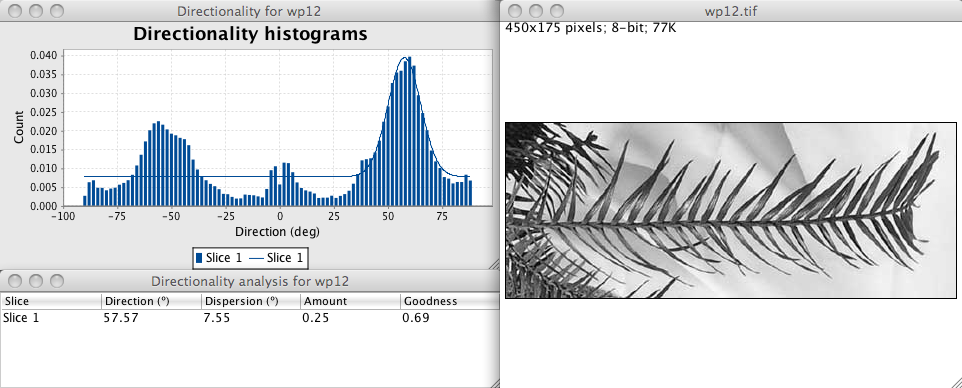
This plugin is used to infer the preferred orientation of structures present in the input image. It computes a histogram indicating the amount of structures in a given direction. Images with completely isotropic content are expected to give a flat histogram, whereas images in which there is a preferred orientation are expected to give a histogram with a peak at that orientation.
For instance, in the pine tree branch pictured above, the needle shaped leaves exist in 2 populations, one with a preferred orientation at about 45°, and another one with preferred orientation around -45°. This is well detected by the plugin, which reports two main peaks at 60° and -60°. On top of that, a minor peak can be seen around 0°, reporting the main branch orientation.
Angles are reported in their common mathematical sense. That is: 0° is the East direction, and the orientation is counterclockwise.
The user interface allows to specify:
- The number of bins (default: 90), that will partition the 180°.
- The starting angle (default:-90°) for analysis. Angles will run from this value to 180° plus the starting value. This option was added to avoid having peaks at +90° split at the borders of the histogram.
- The debug flag, if set, will cause angular filters and power spectrum to be displayed.
- The result table flag will generate a table containing all result value to be displayed. This table can be exported as a CSV file thereafter; see below.
- The orientation map flag will cause the orientation map to be generated; see below.
Statistics generated
On top of the histogram, the plugin tries to generate statistics on the highest peak found.
- The highest peak is fitted by a Gaussian function, taking into account the periodic nature of the histogram.
- The ‘Direction (°)’ column reports the center of the gaussian.
- The ‘Dispersion (°)’ column reports the standard deviation of the gaussian.
- The ‘Amount’ column is the sum of the histogram from center-std to center+std, divided by the total sum of the histogram. The real histogram values are used for the summation, not the gaussian fit.
- The ‘Goodness’ column reports the goodness of the fit; 1 is good, 0 is bad.
A study made on artificial images reveal that the ‘Amount’ value as calculated here underestimates the real proportion of structures with the preferred orientation. So for the pine image up there, one can conclude that the proportion of needle leaves oriented around +60° is at least 25% (however, the image is not completely uniform, which cripples the meaning of this amount value).
Results data export
- Save the Directionality Results window contents to a spreadsheet by copy pasting.
- If you want to save an image of the histogram, right-click on the plot, and choose save as.
- If you want to export the histogram data, check the Data table box in the plugin dialog window. This will generate a results table, that can be exported as a csv file with a right click, or copy pasted directly into a spreadsheet etc.
How does it work?
Different solutions have been thought about, and two of them are currently implemented:
Fourier components analysis
This method is based on Fourier spectrum analysis. For a square image, structures with a preferred orientation generate a periodic pattern at +90° orientation in the Fourier transform of the image, compared to the direction of the objects in the input image.
This plugin chops the image into square pieces, and computes their Fourier power spectra. The later are analyzed in polar coordinates, and the power is measured for each angle using the spatial filters proposed in 1.
Local gradient orientation
This method is local. The gradient of the image is calculated using a 5x5 Sobel filter, and is used to derive the local gradient orientation. This orientation is then used to build the histogram, by putting the square of the gradient norm in the adequate bin. The square of the norm was retained, so as to have an histogram with the same dimension that for the Fourier analysis.
Orientation map
Since version 2.0, the plugin offers the possibility to generate an orientation map, where the image is colored according to its local directionality, or location orientation. This has a well an easily defined meaning in the case of the local gradient orientation method, but things are a bit more complicated in the case of the Fourier component, which is a global method.
In the later case, the image is filtered using the Fourier filters described above, and transformed back using inverse Fourier transform. For each pixel, the direction retained is the one that has the strongest intensity when filtered in this orientation.
To generate the orientation map image, a HSB image is made by taking
- the local orientation as hue;
- the original image gray value as brightness;
- for saturation:
- the power spectrum value for the Fourier component method;
- the gradient magnitude square for the Local gradient orientation method.
Test images
Here is two images stack made to test the plugin accuracy:
VaryingDirection.tif is a 5 slices 16-bit stack made of artificial structures. Each slice is 512x512 pixels, and contains 2000 rods of length 100 pixels in average. 1000 of these rods have a random orientation, the others 1000 have an orientation varying from -60° to 60° from the first slice to the last one. The image is blurred by a gaussian of std 1, and corrupted by Poisson noise. You can use it to determine the accuracy of angle detection. The amount should be close and below 50%.
VaryingAmount.tif has the same parameters than the previous stack, but has a varying amount of orientated rods (from 20% to 100% of the 2000 rods) and a fixed direction of -60° for the orientated ones. You can use it to test the “Amount” score.
Code structure
This plugin is written as a classical ImageJ plugin. It implements PlugInFilter, and relies on PlugInFilterRunner to be run.
String arguments can be passed to it, using the setup(String, ImagePlus) method. For instance:
 ImagePlus imp = IJ.openImage("./TwoLines.tif");
 imp.show();
 Directionality_ da = new Directionality_();
 String command = "/plugins/directionality";
 new PlugInFilterRunner(da, command, "nbins=60, start=-90, method=gradient");
Scripting
General scripting
It is also possible to run the plugin non-interactively from another class, or even in a script. For instance in Python:
from fiji.analyze.directionality import Directionality_
from ij import WindowManager, ImagePlus

# Instantiate plugin
dir = Directionality_()

# Set fields and settings
dir.setImagePlus(WindowManager.getCurrentImage())
# dir.setMethod(fiji.analyze.directionality.Directionality_.AnalysisMethod.LOCAL_GRADIENT_ORIENTATION)
dir.setMethod(Directionality_.AnalysisMethod.FOURIER_COMPONENTS)
dir.setBinNumber(30)
dir.setBinStart(-60)
dir.setBuildOrientationMapFlag(True)

# Do calculation
dir.computeHistograms()
dir.fitHistograms()

# Display plot frame
plot_frame = dir.plotResults()
plot_frame.setVisible(True)

# Display fit analysis
data_frame = dir.displayFitAnalysis()
data_frame.setVisible(True)

# Display results table
table = dir.displayResultsTable()
table.show("Directionality histograms")

# Display orientation map
stack = dir.getOrientationMap()
ImagePlus("Orientation map", stack).show()

# Generate a color wheel
Directionality_.generateColorWheel().show()
Getting the fit parameters
After a request from Jessica Mansfield (University of Exeter, UK) - October 2010.
The plugin uses a fit by a gaussian to compute directionality parameters; however, the fit parameters themselves are not returned. It is possible to get them however using a script.
The gaussian fit has the following form:
\[y = a + (b-a)*\exp\left(-\frac{(x-c)^2}{2 d^2}\right)\]The parameters are returned by the method public ArrayList<double[]> getFitParameters(), which returns a, b, c and d in an ArrayList of double[], one array per slice in the stack.
You can retrieve them and display them with the following script:
from fiji.analyze.directionality import Directionality_
from ij import WindowManager
from ij.measure import ResultsTable

# Instantiate plugin
dnlty = Directionality_()

# Set fields and settings
imp = WindowManager.getCurrentImage()
dnlty.setImagePlus(imp)
dnlty.setMethod(Directionality_.AnalysisMethod.FOURIER_COMPONENTS)
dnlty.setBinNumber(30)
dnlty.setBinStart(30)
dnlty.setBuildOrientationMapFlag(False) # No orientation map

# Do calculation
dnlty.computeHistograms()
dnlty.fitHistograms()

# Display plot frame
plot_frame = dnlty.plotResults()
plot_frame.setVisible(True)

# Display fit analysis
# data_frame = dir.displayFitAnalysis()
# data_frame.setVisible(True)

# Display results table
# table = dir.displayResultsTable()
# table.show("Directionality histograms")

# Get the fit params and put them in a results table
fitParams = dnlty. getFitParameters()
rt = ResultsTable()
index = 1;
for param in fitParams:
rt.incrementCounter()
rt.addLabel(imp.getStack().getShortSliceLabel(index))
rt.addValue('a', param[0])
rt.addValue('b', param[1])
rt.addValue('c', param[2])
rt.addValue('d', param[3])
index = index + 1;

rt.show('Fit param for y = a + (b-a)*exp(-(x-c)*(x-c)/(2*d*d)')
Uses of this plugin
Since there is no publication associated with this plugin, it is hard tracking where it is used. However people wrote me and helped building the following list. The Directionality plugin has been used at least in the following publications:
-
Sensini A., Gualandi C., Zucchelli A., Boyle L., Kao A. P., Reilly G. C., Tozzi G., Cristofolini L., Focarete M. L. (2018), Tendon Fascicle-Inspired Nanofibrous Scaffold of Polylactic acid/Collagen with Enhanced 3D-Structure and Biomechanical Properties. Scientific Reports, 8:17617. doi: https://doi.org/10.1038/s41598-018-35536-8
-
Deravi, Leila F., Nina R. Sinatra, Christophe O. Chantre, Alexander P. Nesmith, Hongyan Yuan, Sahm K. Deravi, Josue A. Goss et al. “Design and Fabrication of Fibrous Nanomaterials Using Pull Spinning.” Macromolecular Materials and Engineering 302, no. 3 (2017).
-
Natalie Reznikov, Rotem Almany-Magal, Ron Shahar, Steve Weiner, Three-dimensional imaging of collagen fibril organization in rat circumferential lamellar bone using a dual beam electron microscope reveals ordered and disordered sub-lamellar structures, Bone, Volume 52, Issue 2, February 2013, Pages 676-683, ISSN 8756-3282.
-
Natalie Reznikov, Ron Shahar, Steve Weiner, Three-dimensional structure of human lamellar bone: The presence of two different materials and new insights into the hierarchical organization, Bone, Volume 59, February 2014, Pages 93-104, ISSN 8756-3282.
-
These two last papers and their methodology have been put in perspective on Pr. Weiner lab webpage.
-
Sensini, A., Gualandi, C., Cristofolini, L., Tozzi, G., Dicarlo, M., Teti, G., Mattioli-Belmonte, M. & Focarete, M.L. (2017) Biofabrication of bun- dles of poly (lactic acid)-collagen blends mimicking the fascicles of the human Achille tendon. Biofabrication 9(1), 1–13. <doi:https://doi.org/10.1088/1758-5090/aa6204>
-
SENSINI, A. , CRISTOFOLINI, L. , FOCARETE, M. , BELCARI, J. , ZUCCHELLI, A. , KAO, A. and TOZZI, G. (2018), High-resolution x-ray tomographic morphological characterisation of electrospun nanofibrous bundles for tendon and ligament regeneration and replacement. Journal of Microscopy. <doi:10.1111/jmi.12720>
If you use it, please tell me so that I can add to this list.
Version history
- v2.0: After a lot of mistakes and problems, each method now propose to generate an orientation map, which colors the image according to the local directionality.
- v1.2: Added a new analysis method based on local gradient orientation.
- v1.1: Added an option to export the histogram as a table.
- v1.0: First working commit with the Fourier method.
Wish list for this plugin
Possible way for further developments:
- Have a peak finder that can deal with multiple peaks and return statistics on them.
- Add a radial filter to the Fourier method, that would allow to pick only structures with a given length (+/- bandwidth). Conversely, add a scale option to the Local gradient orientation method.
References
A discussion with A. Leroy and another one with J. Schindelin are greatly acknowledged.
-
Liu. Scale space approach to directional analysis of images. Appl. Opt. (1991) vol. 30 (11) pp. 1369-1373 ↩