Plugin to perform Delaunay Triangulation, or draw the Voronoi Diagram for a given point ROI.
Definitions
The Delaunay Triangulation for a set of points gives you triangles connecting all the points such that for each triangle, there are no other points in the circumference of that triangle than the three corner points.
An equivalent definition of the Delaunay Triangulation is that of all the triangulations of the points, the Delaunay Triangulation has the maximal minimal angle (i.e. if you take the minimal angle of all the triangles, the one of the Delaunay Triangulation is the largest of all triangulations).
The dual problem is the Voronoi Diagram: given a set of points, visualize those coordinates that have equal distance to the closest two (or more) points.
A picture says more than thousand words:
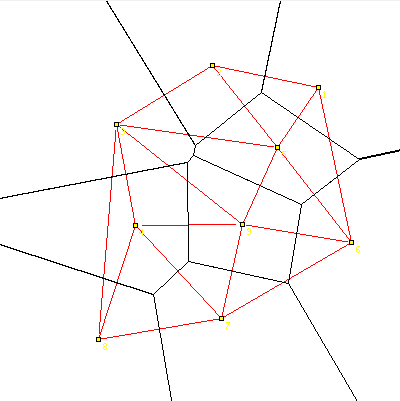
The points are little yellow squares, the Delaunay Triangulation is drawn red, and the Voronoi Diagram is black
Usage
This plugin operates on a point selection consisting of multiple points.
- Select the Point tool (the 7th tool from the left in the main window).
- Select the first point by clicking into the image.
- Select subsequent points by holding down the Shift key while clicking into the image.
- Run Plugins › Analyze › Delaunay Voronoi to generate the triangulation between points.
- If you check the “interactive” box you can also add additional points (while still holding Shift) which will automatically become part of the triangulation.
The plugin shows this dialog when it is called:
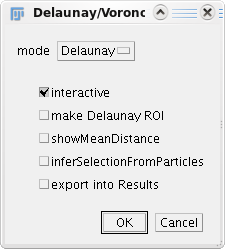
Options include:
- In interactive mode, you can move the point selection, but the diagram is not drawn to the image; It is only overlayed.
- When selecting make Delaunay ROI, instead of drawing the diagram, the point selection is replaced by a line ROI resembling the Delaunay Triangulation (but for technical reasons, many lines will be in that selection twice).
- If you ask for the mean distance, it will be output to the Results window.
- After the Particle Analyzer was run, you can infer the selection from the particles.
- Lastly, you can export the lines of the Delaunay Triangulation into the Results window.
Version history
- 2006/08/14: First public version
- 2006/08/19: Fix zooming; draw diagram in zoom indicator
- 2006/08/20: Fix zooming of selection; have a dialog to chose parameters
- 2007/05/31: Optionally get points from Particle Analyzer, and optionally show mean distance
- 2007/07/20: Optionally generate a ROI instead of an overlay or drawing the lines
- 2008/11/27: Optionally export the lines of the Delaunay Triangulation into the Results table