This page presents exercises for software developers to use for debugging Fiji.
If you are a user looking to troubleshoot issues, see the Troubleshooting page.
Debugging is the art of determining the cause and/or location of a problem. The purpose of this guide is to provide developers practical, hands-on experience using a variety of debugging techniques to identify problems in code.
Requirements
As Fiji is built using the SciJava principles of project management, this guide assumes a basic familiarity with these topics and tools, especially:
Additionally, you should:
- Install an IDE - this guide is written with Eclipse in mind.
- If using Eclipse, install the memory analyzer plugin.
- Clone the imagej-troubleshooting companion repository, which this guide is designed around, and import it as a Maven project into your IDE.
- Install the jvisualvm tool.
Finally, you should read Lars Vogel’s Java Debugging with Eclipse tutorial. Note that there is significant overlap between the topics covered between these tutorials. Vogel’s guide does a fantastic job of laying out the debugging interface and tools in Eclipse, while this guide focuses on providing hands-on practice and explaining the reasoning for when to use these tools. If you find yourself confused when this tutorial asks you to do something in Eclipse (e.g. “start debugging”, “step into”) it’s almost certainly covered in Vogel’s guide.
What not to do: print statements
For many developers, the first tool in their debugging toolbox is the print statement. Print statements are easy to lean on as a safety crutch: you don’t need any special knowledge to use them, and they often work to answer common questions (e.g. “why is this variable null here?”, “how many elements are in my array here?”).
However, there are critical drawbacks to trying to debug via print statement:
- They are slow. If you realize you need to move or add a print statement, you need to recompile your code and re-launch your application.
- They are part of the code. Adding print statements changes line numbers, causes git to pick up modifications to the source code, and can even affect performance and/or behavior.
- They are limited. Even the most basic breakpoint and expression evaluation in Eclipse debug mode gives you vastly more power and flexibility over print statements.
Learning to use debugging tools is, understandably, a burden: it’s “one more thing” to learn as a developer. But if you want to develop plugins, you will almost certainly run into cases where debugging is necessary. So you may as well start familiarizing yourself with the tools now, gaining skills and perspectives that will serve you well throughout your career.
Using this guide
The goal of these exercises is not to solve the problems, but to build up your toolbox of troubleshooting techniques and develop your intuition for when to apply each technique. To keep exercises simple and focused, none explicitly use Fiji. But once you learn how to debug an external Java application, you will have the knowledge to apply any of these techniques to a rich, and complex, applications like Fiji.
Because this project is intended to help new developers practice troubleshooting skills, you may find these examples contrived - indeed, they are. Exercises are kept simple and focused to allow practice of targeted techniques. If you have complete knowledge and understanding of the code there isn’t really a need for troubleshooting: it is trivial to see why something is behaving incorrectly. Thus the source of these exercises is divided into hidden and visible packages. Users are strongly recommended to only inspect and set breakpoints from the visible classes. From a development point of view, consider the hidden package a 3rd-party library that you may not have control over, or access to the source code.
Changing the source code to actually fix the bugs is outside the scope of this guide, but motivated users are of course welcome to do so for practice.
If at any time you need to revert changes to the imagej-troubleshooting repository, you can always do so via the command:
git reset --hard origin/master
Exercises
Exercise 1: Stack Traces and Breakpoints
Goals
- Interpret a stack trace
- Practice setting breakpoints in Eclipse
- Use the Variables window to inspect variable values
- Use the navigation commands to execute code in Debug mode
Breakpoints are a fundamental tool of debugging. They provide a way to instruct Java to stop code execution when a certain line of code is encountered, providing a chance to explore actively running code.
To get started in this exercise, open up the source file - E1BasicBreakpoints - and run it to get an idea of what’s going on. We should see a simple stack trace:
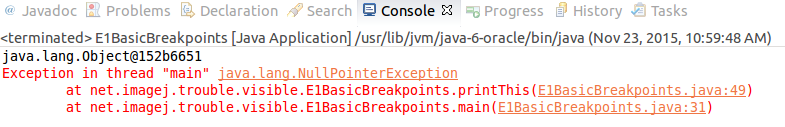
Stack traces are a common starting point for debugging, as they are typically automatically produced when something goes wrong that the program was not prepared to handle. Java programs are executed in Last In, First Out order; that is, starting with the main method, as methods are called they are added to the top of the stack, the method at the top is what’s currently running, and when a method completes it is removed from the stack, returning the program to the next method in line. When an exception occurs, a stack trace is printed, showing the order that methods have been queued, with the top of the stack being the location of the exception (and thus a likely place to start looking for problems!).
So looking back at the stack trace we got, we can see what went wrong (tried to use a null object) and where it happened (the line number at the top of the stack), but we don’t know why the object was null at that point - which would be the actual root cause of the exception.
To investigate further, try to complete the following debugging steps:
- Set a breakpoint in the
mainmethod, beforemakeAThingis called - Debug the file as a Java application
- When the breakpoint is encountered, step in to the
makeAThingmethod - step over the line constructing a new
Object - step out of the
makeAThingmethod - In the Variables window, look at the value of the Object variable
- ‘resume’ execution until the program completes
Quiz! Now that you’ve walked through the program, do you know why we got a NullPointerException?
Answer: Although makeAThing does create an new Object, that Object isn’t actually returned by the method.
Takeaway
- Stack traces are helpful in identifying starting points for debugging
- The Debug view allows line-by-line execution of code and inspection of variable values to help us pinpoint errors
Exercise 2: Expressions
Goals
- Set breakpoints on exception creation
- Use the Expressions window to evaluate code at runtime
Although breakpoints allow us a chance to peek inside running code, many times when debugging you’ll find that you’re missing a piece of information not provided by the current code - perhaps you’d like to call a utility method, or construct a new object temporarily. All of these operations are Java expressions - statements in Java syntax resolving to a single value (essentially - one line of code). Instead of making these changes in your program’s code and recompiling, in Debug mode we can dynamically evaluate any expression on-demand, without changing the source.
Start by opening the E2EffectiveExpressions source and running it. Like the previous exercise, we have a stack trace to start from:
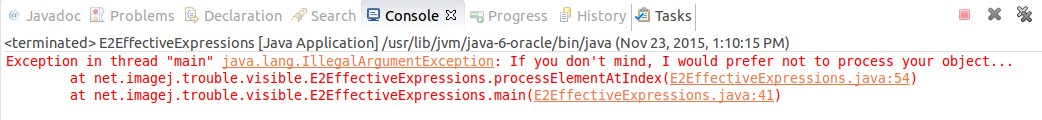
Try setting a breakpoint on the conditional line:
if (index < 0 || index >= list.size()) {
Quiz! Try debugging now, using Resume any time a breakpoint is encountered. How many times do you hit a breakpoint?
Answer: Three times. This is because we’re debugging inside a method that is used multiple times in our program.Since we are only interested in the processElementAtIndex method when a problem actually occurs, let’s try something different:
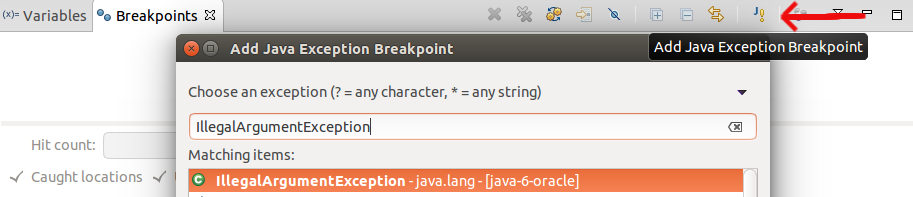
Setting a breakpoint on an exception
- From the Breakpoints window in the Debug perspective, delete the old breakpoint
- Now use the Add Java Exception Breakpoint button to add a breakpoint to IllegalArgumentException
- Debug the program. When it stops, inspect the Variables window.
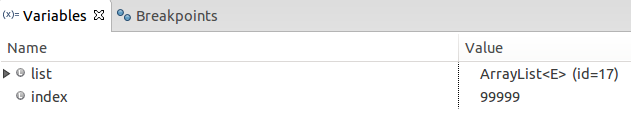
Inspecting the variables window
At this point, we know there is a problem accessing the 99999th element of the list, but the variables window doesn’t tell us exactly what the problem is. We can manually expand and explore the list variable - but given its size that could be cumbersome.
Instead, let’s use expressions. If it’s not already visible, open the Window › Show View › Expressions view.
In this view, we can add any number of Java expressions to evaluate. We can call methods from, and on, any variables and classes visible from the current scope.
If you evaluate expressions that change the state of variables, for example List.add, then those changes will persist. Sometimes you do legitimately need to alter the state of variables while debugging (for example, to force the conditions in which a bug appears). Just be aware that you could also be introducing problematic behavior when evaluating expressions.
To complete this exercise:
- Write an expression that calls the
size()method of our list. - Write a 2nd expression that evaluates to the value of the
indexvariable
Quiz! Once you’ve evaluated these expressions, can you tell what went wrong in the program?
Answer: We asked for a list of size 100,000 but a list of size 99,999 came back. Since we used hard-coded indices, instead of size-relative (e.g.list.size()-1), a method was called wanting to access a non-existent element.
Takeaways
- Setting breakpoints on exceptions avoids unnecessary breakpoint hits (and can be useful when we aren’t sure where to set the breakpoint)
- The Expressions window of the Debug view allows us to evaluate arbitrary Java expressions without modifying our source code
Exercise 3: Conditional breakpoints
Goals
- Create a breakpoint that triggers after a specified number of hits
- Create a breakpoint that triggers when a certain condition is true
Breakpoints trigger every time the corresponding line would be executed, which may be undesirable for repeated code blocks. It may be enough to carefully consider the breakpoint placement - on an exception, or within a conditional block. But when these options aren’t available, we can make our breakpoints more powerful by triggering only when there’s something of interest to see.
Start by opening the E3ConditionalCrisis source and running it. This time our console output looks a bit different:
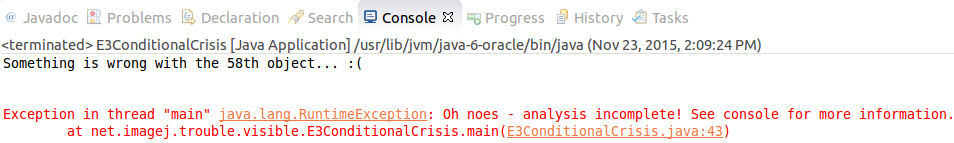
In addition to the exception stack trace, the program itself appears to have found an invalid object, causing the processing to go unfinished. Although we could set a breakpoint on the exception, as we did in exercise 2, the exception is actually happening after the more interesting part of the program - the loop. As we learned in exercise 2, breakpoints in code that is called repeatedly are annoying, so let’s see what we can find by attaching conditions to our breakpoint.
First set a breakpoint on the line after the everythingIsOK assignment:
everythingIsOK = ObjectAnalyzer.processElementAtIndex(myArray, i);
i++;
Then try the following:
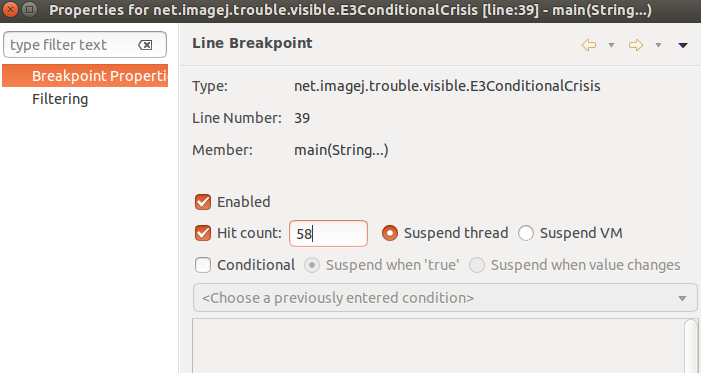
Setting a hit count
- Open the Breakpoints window
- Right-click our breakpoint and select Breakpoint Properties…
- Check the Hit Count box and set it to the object number printed in the error message.
- Try debugging
Quiz! Was there a problem with the current object when/if your breakpoint is hit?
Answer: If there was, try it again! In this exercise, the “broken” object index is non-deterministic—so it is unlikely to be exactly the same index two runs in a row. If the broken object appears later the second time, your breakpoint will hit but the current object will likely be fine. If the “broken” object appears earlier the second time, your breakpoint won’t be hit at all.Using count-based conditional breakpoints can be very useful if the error is deterministic. In this case we need to try something different. We know the everythingIsOK flag reflects the integrity of the object at a given index - so what we really want to use here is a breakpoint that stops in the loop when the everythingIsOK flag is set to false. Fortunately, breakpoints have an optional “Conditional” flag - where we can enter any Java statement that resolves to a boolean value. Try it out:
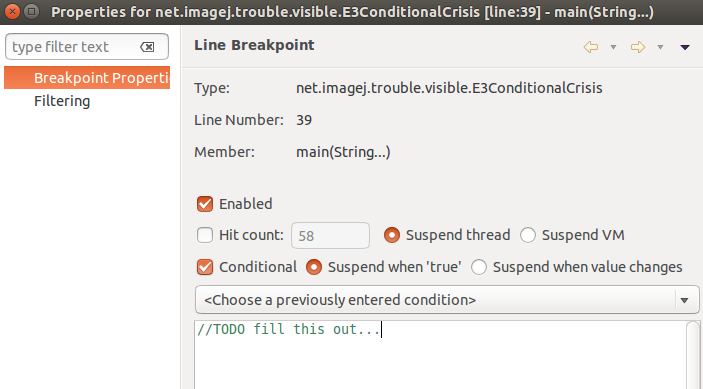
Setting a conditional expression
- Open the Breakpoints window again
- Open the properties of our breakpoint
- Uncheck the Hit Count box
- Check the Conditional box, and “Suspend when ‘true’”
- Enter the condition we want to check
- Try debugging again
Were you able to get the breakpoint to stop in the loop only when a problem is encountered?
Quiz! What was suspicious about the object at that index?
Answer: The object wasnull.
Takeaways
- Setting a hit count on a breakpoint is useful if problematic code is called multiple times
- If problems appear randomly, using a conditional expressions on the breakpoint can help
Exercise 4: Fiji plugins
Goals
- Start a debugging session in Eclipse that connects to a running Fiji instance
Exercises 1-3 are abstract, self-contained programs. The E4RemoteResearch class, on the other hand, is an actual Fiji plugin. Although plugin developers typically set up tests to run their plugin within Fiji, it is impossible to test all possible runtime environments: users could have a variety of update sites enabled, custom plugins installed, etc… and each modification is an opportunity for dependency skew and clashes with your plugin. When problems do arise, it is invaluable to have the ability to debug a running copy of Fiji itself.
E4RemoteResearch does still have a main method to demonstrate the expected output for this plugin - in this case, simply printing the concrete implementation of the ConsoleService. Run the class in Eclipse and you should see some simple output in the console:
I found our console service! Look: class org.scijava.console.DefaultConsoleService
Next, we want to run this plugin in Fiji and see what happens:
- On the command line, run
mvn clean installfrom theimagej-troubleshootingdirectory, to build a.jar - Copy the produced jar (e.g.
target/imagej-troubleshooting-0.1.0-SNAPSHOT.jar) to thejarsdirectory of your Fiji installation - Start Fiji
Note that the menu path of the plugin is specified in the class’s annotation:
@Plugin(type = Command.class,menuPath = "Plugins>Troubleshooting>E4 - Print ConsoleService")
So, you can now run the E4 - Print ConsoleService command either via the menus or the search bar. You should get an exception:
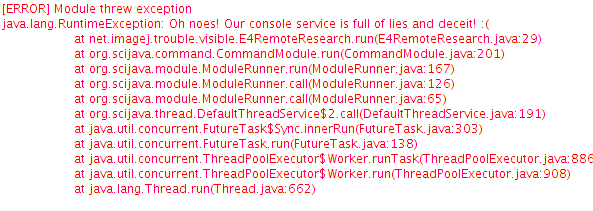
In order to connect Eclipse to Fiji, we need to close our running instance and launch Fiji from the command line, which allows us to set the debug flag, e.g.:
Fiji/fiji --debugger=8000
On Windows we need to add the console flag:
Fiji/fiji --debugger=8000 --console
See this issue for more information.
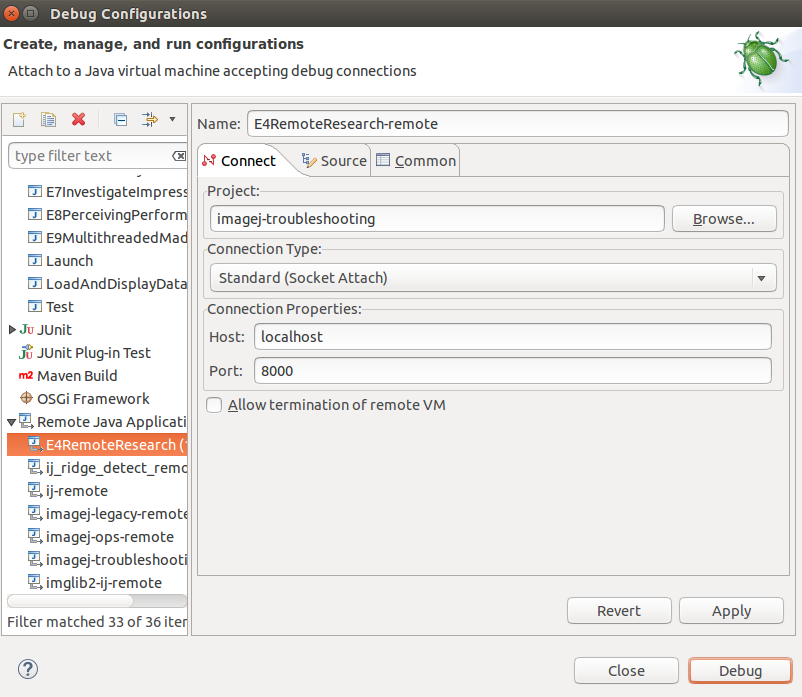
Remote Java Application debug configuration
This will start up Fiji in a mode that’s able to communicate with Eclipse. Next we need to connect Eclipse to the running Fiji instance:
- Right-click the
E4RemoteResearchsource file in the Package Explorer - Select Debug As › Debug Configurations…
- Scroll down the list of configurations (or search) until you find
Remote Java Application - Double-click
Remote Java Applicationto create the debug configuration - Rename the configuration to
E4RemoteResearch-remoteto distinguish it. If necessary you can update the port to match what was specified when you started Fiji. - Click the
Debugbutton to start a remote debugging session
At this point Fiji and Eclipse should be communicating. It’s important to understand that the information flow goes from Fiji to Eclipse: Fiji says “I am at line number X in class Y” and if Eclipse looks in the source files it knows about, and stops if it finds a breakpoint at that location.
However, when Eclipse looks at its source files, it’s not looking at the actual classes that were used to launch the remote Application. In fact, the classes Eclipse looks in depend entirely on the classpath of the project that was used to start the remote debugging session. So when you are remote debugging, there are two best practices to follow:
- Launch the remote session from the project you’re interested in (if you want to debug a class in
scijava-common, don’t start the session from theimagej-legacyproject) - Make sure the source in Eclipse matches what’s in the remote application (an easy way to guarantee this is to build the
.jarand copy it to the application)
Since we already followed these best practices, we can now finally debug our plugin:
- In Eclipse, set a breakpoint on the line where the
ConsoleServiceis being cast toDefualtConsoleService - In Fiji, run the
E4 - Print ConsoleServicecommand - In Eclipse, when the breakpoint is hit, inspect the value of the
consoleServicefield
Quiz! What is the class of consoleService?
Answer: It’s a LegacyConsoleService.
Quiz! Extra credit: why did this plugin work when we ran its main method, but not in Fiji?
Answer: The Context in the main method is built with only one ConsoleService implementation available - DefaultConsoleService. In the full Context used in Fiji, a higher-priority LegacyConsoleService overrides the DefaultConsoleService.
Takeaways
- Launching Fiji from the command line allows us to add useful flags and collect debugging information
- Attaching Eclipse to a running Fiji lets us debug plugins in a “production” environment
Exercise 5: Git history
Goals
- Practice using git bisect to locate historical breakages
Debugging code directly via the techniques we’ve discussed thus far is not always practical. If the code is excessively complex, or the problem subtle, it may not be practical to try and step through code execution - you may not even be sure where to start. Keeping code well-structured and well-documented can help here, but we have another resource to draw on: the history of changes to our code, via git commits - assuming appropriate development practices are used. Identifying the breaking change gives us more information to use in our diagnosis (and in some cases, can be fixed with a simple git revert]).
So, the first thing we’ll do is run the E5HistoricalHysteria class and verify that it fails. For this exercise we have some additional information: this class used to run successfully, and a tag was made at that point.
To find what tags are available, on the command line we can run:
$ hinerm@Nyarlathotep ~/code/imagej/imagej-troubleshooting (master)
git fetch --tags

$ hinerm@Nyarlathotep ~/code/imagej/imagej-troubleshooting (master)
git tag -l
e5-good-maths
The purpose of the bisect tool is to search our commit history to find the breaking commit. Although you could search one by one through the commit history, this would take Time complexity#linear-time in proportion to the number of commits to search. Bisecting performs a Binary search algorithm#Performance, speeding up the process significantly. It also allows much of the process to be automated.
To use the bisect tool we just need to know two commits: one where the test worked, and one where the test failed. In this case, we know the e5-good-maths tag worked, and our current state is broken, so we can start the bisect:
$ hinerm@Nyarlathotep ~/code/imagej/imagej-troubleshooting (master)
git bisect start master e5-good-maths
Bisecting: 9 revisions left to test after this (roughly 3 steps)
[d2e45589ca3671c93f772d4310fed9653ca1569b] E5: Zach likes the maths!
$ hinerm@Nyarlathotep ~/code/imagej/imagej-troubleshooting ((d2e4558...)|BISECTING)
In each step of the bisect git will automatically move you to a new commit to be tested. “Testing” simply involves trying to reproduce the error and letting git know if this commit is good or bad. While bisecting, the whole local repository is in a special “BISECTING” mode - so that git can remember your answers for each commit. If you ever make a mistake (marking a commit incorrectly) you can abort the process via git bisect reset.
Now that you’re bisecting, follow these steps until you’ve identified the failing commit:
- In Eclipse, refresh the
imagej-troubleshootingproject, to ensure that the current commit is what’s being tested - Run the
E5HistoricalHysteriaclass - On the command line, use either
git bisect badorgit bisect gooddepending on if an exception was thrown or not
After marking the last commit good or bad, bisect will print out the first bad commit. You can use git bisect reset to finish bisecting.
git bisect?Answer: ``` commit 3102e5620a61978b52a733a0733c83899aeddc66 Author: Mark Hiner hinerm@gmail.com Date: Fri Nov 20 13:46:34 2015 -0600
E5: More maths plz! ```</span>
</details>
Takeaways
- Use all resources available when debugging - even the git history can be useful (assuming it’s well-maintained!)
Exercise 6: Print stack trace
Goals
- Identify problematic code when no feedback is given
When debugging we’re trying to identify why a program isn’t behaving as expected. Often this starts in response to an unhandled Java exception, which comes with a helpful stack trace to point us in the right direction. Unfortunately, there are also times when no information as given - such as when the JVM hangs (gets stuck) or crashes without warning. In this exercise we’ll look at another way to extract information from our application: by forcing a stack trace to be printed.
As we did in exercise 4, the first thing to do is build the imagej-troubleshooting.jar and install it in your Fiji/jars directory. Then you can start up Fiji and run the command for this exercise: Plugins › Troubleshooting › E6 - Start Looping
After running this command, you should notice Fiji sitting around for a few seconds… and then close unexpectedly. As this crash doesn’t give us any leads to follow, the next thing we should do is look at the code:
NotALoop.dontLoopTwice();

NotALoop.dontLoopThrice();

NotALoop.dontLoopForever();

NotALoop.loopForever();
We see four methods are being called. What do they do..? No idea! But we know one of them (at least) is bad. So let’s do what we can to learn what’s happening in our application up until the crash.
To investigate further, close Fiji (if it’s running) and launch it again from the command line, e.g.:
Fiji/fiji
We actually don’t need any extra flags this time, as this technique isn’t specific to Fiji. When you run a program from the command line, your console is directly tied to the running instance:
Waiting for input after launching Fiji

In this state, we can still send signals to the running application (for example - ⌃ Ctrl + C to kill the app).<div class="notice notice-tip" style="font-size: 2;"><div class="notice-icon">💡</div><div class="notice-content"><p>When running a Java application, we can use ⌃ Ctrl + \ (⌃ Ctrl + Pause on Windows) to print a stack trace. See the print stack trace instructions for more information.</p> </div> </div>
With this knowledge:
- Run the
E6 - Start Loopingcommand from Fiji - Before Fiji crashes, switch back to the terminal and use ⌃ Ctrl + \ to print a stack trace
- Because we want to guess what the last method to run is, keep taking stack traces until Fiji crashes
- Look back through the console text and find the last method to be executed
Hint: raw stack dumps like this are not the easiest to read. Stack traces for all the threads in the JVM are printed, as well as additional information we’re not interested in. Look for the the sections of stack traces sorted by thread, like you would see in an exception message, and find the E6SleuthingSilence class. Whatever follows that entry is at the top of the stack, and thus what was being processed on that thread when you took the stack trace.
Quiz! What method did you identify as being last executed before the crash?
Answer:net.imagej.trouble.hidden.NotALoop.dontLoopForever is what you should find. Note that there is some hand-waving in this exercise: it’s possible that this method could have returned and a subsequent method caused the actual crash! But we at least have gained information, in that we know the dontLoopForever method was executed.
Takeaways
- Manually acquiring stack traces is useful when we don’t have anything else to go on (e.g. if our program crashes without warning, or becomes unresponsive)
Exercise 7: Out of memory
Goals
- Learn how to acquire heap dumps
- Analyze a heap dump for potential problems
Memory problems are a different kind of beast. Java is constantly in the process of reclaiming objects that are no longer in use (garbage collection). If something mistakenly holds onto an object when it shouldn’t you have a memory leak (for example, a user closes an image, but an array of the pixel data is preserved). Depending on the size of the leak, it might not even be encountered (e.g., only after opening 10,000 images).
Memory errors can be especially tricky to reproduce because, once memory is used up, any object creation can trigger an OutOfMemoryError. So the resulting stack trace may be misleading. Instead, what we want to do is examine the Java heap space (where object instances are stored) and figure out what went wrong.
First things first, run E7InvestigateImpressions and see what happens. You should see it print array names for a while, and then eventually hit an OutOfMemoryError.
Looking at a snippet of the code:
for (int i = 0; i < 100; i++) {
   System.out.println(ObjectMaker.getFloatArray(size));
   System.out.println(ObjectMaker.getLongArray(size));
   System.out.println(ObjectMaker.getDoubleArray(size));
}
We see that objects are being created, but we aren’t storing any references to them. They should just be printed and discarded. So presumably one of these methods is doing something nasty, and it’s up to us to figure out which by analyzing the heap space. In particular, we want to analyze the heap space at the time of the error. jvisualvm is used to attach to running Java programs; so we will need to set a breakpoint on the OutOfMemoryError itself - similar to what we did in Exercise 2: Expressions - and debug the E7 program.
Once the OutOfMemoryError is encountered our breakpoint will trigger. To acquire the heap dump:
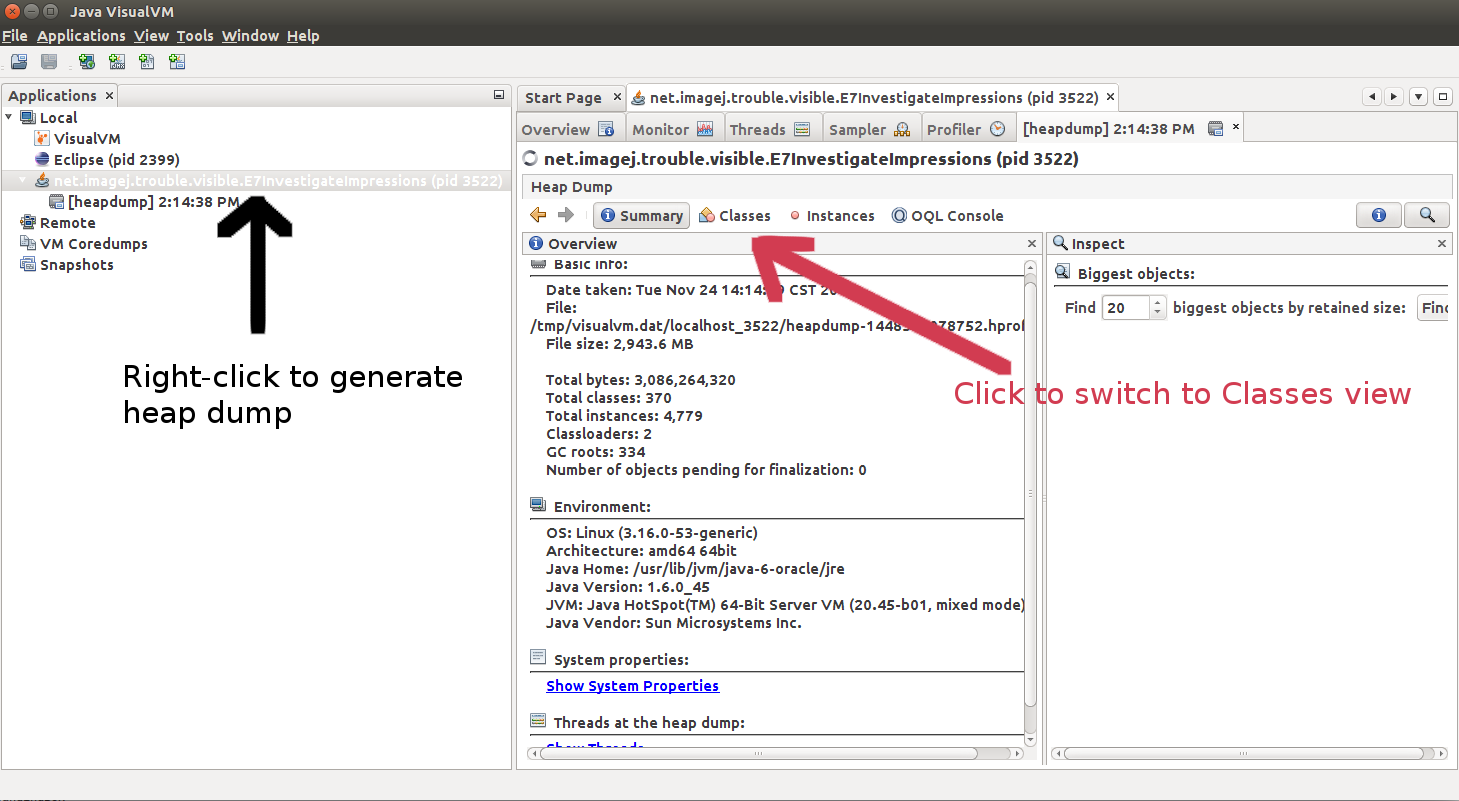
Heap dump acquisition in jvisualvm
- Open
jvisualvm - From the list of local applications, right-click on
net.imagej.trouble.visible.E7InvestigateImpressionsand select the “Heap Dump” option. - The “Summary” view is open by default; switch to the “Classes” view of the heap dump
- Sort by Size
Quiz! What class is occupying the majority of memory?
Answer:java.lang.Float[]
So now we know what’s taking up all of our memory - but we don’t actually know why. Although jvisualvm does have the tools to investigate further, the Memory Analyzer plugin for eclipse has several nice conveniences for further heap dump exploration. Let’s take a look:
- With the heap dump selected in the Applications list of
jvisualvm, use File › Save As… to save the.hproffile. - Back in Eclipse, open the “Memory Analysis” perspective (Window › Perspective › Open Perspective › Other… › Memory Analysis if you’ve never opened this perspective before)
- File › Open Heap Dump… and select the file you created in step 1
- Under the
Actionscolumn of the heap dump Overview, click onHistogram- which opens in a new tab - Filter the classes of the histogram based on the problematic class you identified in
jvisualvm - Right-click the row for the problematic class and select the “Merge Shorted Paths to GC Roots > exclude weak/soft references” option.
There is a huge amount of information that can be browsed in the heap dump. Most of the options available via the right-click context menu are short-cuts for SQL queries. When we look at a “path to the GC root”, we’re looking at a chain of references between objects that’s keeping the selected class alive. Because we’re investigating memory leaks we can typically exclude weak and soft references, as these should be released before an OutOfMemoryError occurs.
Quiz! Expand the classes in the “merge shortest paths” tab until you get to the first child of the ObjectMaker class. What is the child’s variable name and class?
Answer: It is a java.util.HashSet with the name cache. ObjectMaker seems to store the Float[] instances in a set, creating strong references that prevent the arrays from being garbage collected.
In this exercise we acquired the heap dump manually via jvisualvm. When you right-click on an application you can also set heap dumps to be acquired automatically when OutOfMemoryErrors occur. Heap dumps can also be acquired directly through the Eclipise MAT plugin, in the Memory Analysis perspective.
Takeaways
- To identify subtle problems, like memory leaks, it helps to learn how to use external tools - like
jvisualvm
Exercise 8: Profiling
Goals
- Identify performance bottlenecks
In the other debugging exercises, we look at programs failing due to errors. Another common concern is program performance - does your program run in a reasonable time frame? This often can not be deduced by simply looking at the code. So the first step in fixing performance is identifying the location of the slowdown.
Exercise 8 in pretty straightforward with the main function calling two functions - doStuff() and doMoreStuff(). Both functions are called one after the other for two minutes. Our goal is to find which function is slower than the other. One solution a programmer may think of is to keep track of time taken by comparing values returned by System.currentTimeMillis, but this method does not scale up for large program and requires modifications to the code. It is much more efficient and useful to use a profiler to monitor time spent in methods - which is part of the jvisualvm troubleshooting tool.
Steps for exercise
- Insert a breakpoint on the
whilestatement in main method - Launch JvisualVM. All running Java applications are shown in the in Applications Tab (left margin) of JvisualVM. Double Click to select E8PerceivingPerformance. Go to the profiler tab and click the CPU option.
- Click on the settings checkbox on upper right corner of Jvisualvm. In CPU settings , make sure the class being profiled is
net.imagej.trouble.**instead ofnet.imagej.trouble.visible.**, or the profiler won’t be looking in the right place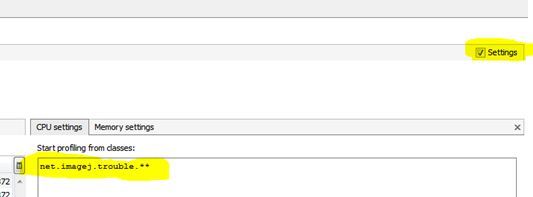
Adjust settings
</figcaption></figure>
- Switch to Eclipse and resume the execution of code
- Wait for the stipulated time, twiddle your thumbs. Or you can switch to JvisualVM and see how much time is taken by each of function in real time.
- Example output
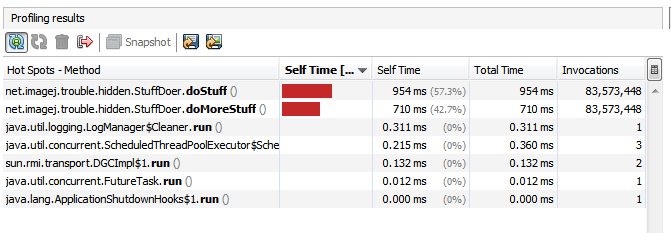
Profiling Results
</figcaption></figure>
Quiz! Which method takes more time? doStuff or doMoreStuff?
Answer: doStuff. Exact timing will vary per computer, but in our case doStuff took 954 ms while doMoreStuff took 710 ms.
Quiz! Are the number of invocations/function calls of both functions the same?
Answer: Yes. This number will change based on the length of profiling, but in this case we see both methods were called 83,573,448 times - so the difference in timing is truly due to length of method execution.Takeaways
- Profiling tools allow quick and precise identification of performance bottlenecks.
Exercise 9: Multiple threads
Goals
- Observe the effects of debugging in multithreaded environments
Developing codes may often involve using multiple threads instead of sequential execution of statements. New threads may be spawned anytime when required. Essentially, threads should be used to run independent processes but if threads work on the same process there is no guarantee of execution of statements in different threads in a particular order.
E9 exercise on multiple threads focuses on this issue and also highlight an additional property of breakpoint that can be helpful in debugging program (Stop Virtual Machine).
Even though no code changes, sometimes debugging affects code execution. The Exercise 9 creates two parallel processes which are interdependent on each other. Each process throws up an error if the other process introduces a delay more than one second. So pausing for more than one second ,while debugging the program throws up an exception. So the act of debugging introduces errors in this case. 
Steps for the exercise
- Run E9 with no breakpoint. Note that it works fine
- Now set a breakpoint in the “getName” method of either the Even or Odd LonelyRunnable
- Set the breakpoints property to “Suspend thread”
- Debug E9. After hitting the breakpoint, wait for a few seconds. Eventually you should see that a different thread is paused and “Expecting Exception”.
- resume the threads and see the stack trace.
- Now modify the breakpoint and tell it to suspend VM instead of just the thread.
- Debug again. When you hit a breakpoint, make sure you resume the VM and not just the thread.
Takeaways
- The act of debugging can change the way our code executes. Find the right approach for the situation.
- In case of multithreaded programming, set breakpoints to stop the virtual machine at the breakpoint to freeze the state of all threads.
What next?
At the start of this guide we mentioned that the goal of debugging isn’t explicitly to fix the problem. So a natural question that follows is - once we’ve successfully identified the cause of an issue (or at least narrowed things down), what are the next steps to take?
The answer depends on the debugging developer’s skill and responsibilities, and whether or not they have identified a fix (a fix is often easy to come up with once the problem is identified).
If a fix is identified:
- If you are a maintainer of the component you can make the fix directly, or use a topic branch if the fix needs discussion first.
- If you do not have commit rights to the repository, you can contribute the fix via pull request
If a fix is unclear:
- Use any of the standard channels for help.
Even if you can’t contribute a fix, if you went through the effort of debugging - at the very least you should identify the problem, steps you took to debug, and potential fix(es) via a bug report so that your effort is not lost.