The content of this page has not been vetted since shifting away from MediaWiki. If you’d like to help, check out the how to help guide!
{| |style=”vertical-align:top” | |}
|}
Introduction
The Volume Calculator plugin is designed to let users measure the volumes of arbitrary segments of blood vessels by selecting them directly from a 3D image. Although Volume Calculator was developed for quantification in a mouse hindlimb ischemia experiment, it should be useful for the volume measurement of any network. This possibility is determined by the following requirement: the plugin is configured to work best with images that can be read and analyzed by the Skeleton 3D and Analyze 3D plugins. Hence, it is suggested that users first check their images with these two plugins.
Volume Calculator uses three Fiji plugins:
- Skeletonize3D for performing the skeletonization,
- AnalyzeSkeleton for the analysis and
- 3D Viewer for display.
Usage
The section explains how to use Volume Calculator. A Magnetic Resonance Angiogram Magnetic resonance angiography|(MRA) is used as an example image. This MRA is of the hindlimb vasculature of a mouse and was performed in vivo.
Image Acquisition
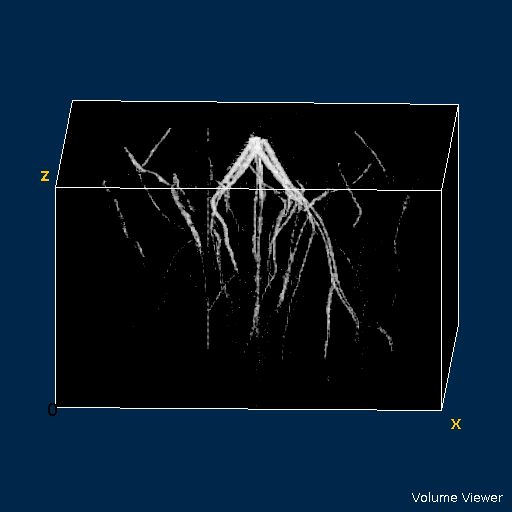 Figure 1. 3D view of mouse hindlimb vasculature.
The image can come from any source. But be aware of the plugin’s limitation: see the Introduction above. Figure 1 shows a 3D rendering of the example MRA. This MRA consists of 150 slices, each 512 X 512 in size.
Thresholding
If your image is not binary then it must be thresholded in order for the first stage in the Volume Calculator to work. These settings are often determined by the nature of the image, for example, its noisiness, or by what features you wish to retain. You can pretest this image by running the image through the Skeletonize3D plugin. A second test can be performed by taking this skeleton image and applying to the AnalyzeSkeleton plugin to see if it can be analyzed. If it can not be analyzed then oftentimes adjusting the threshold can make it “analyzable”.
Volume Calculation
The Volume Calculator is located at Plugins › Analyze in the Fiji menu. When run, it will take the current image as input. Processing begins immediately; its progress is shown in the status bar. After a successful run, the plugin will display the Volume Calculator window (Figure 2.) This window is actually the 3D Viewer plugin. Volume Calculator has taken its final result - a Java 3D representation of the analyzed image - and asked the 3D Viewer to display it.
User Interface
 Figure 2. Volume Calculator user interface.
Because the 3D Viewer plugin is used for display, its menu is available at the top of the window. Below this menu line is the image area where the image can be manipulated with all of the available 3D Viewer commands. At the bottom of the window is an additional area that Volume Calculator uses to display volume results. It will be discussed in more detail in the next section. Below this area are two check boxes. These check boxes alter the display and behavior of the 3D Viewer. Checking the Bounding Box will cause the 3d Viewer boundary box to be displayed. Checking Key Nav. Only allows you to perform 3d transformations such as rotation with the just the directional keys.
Selection
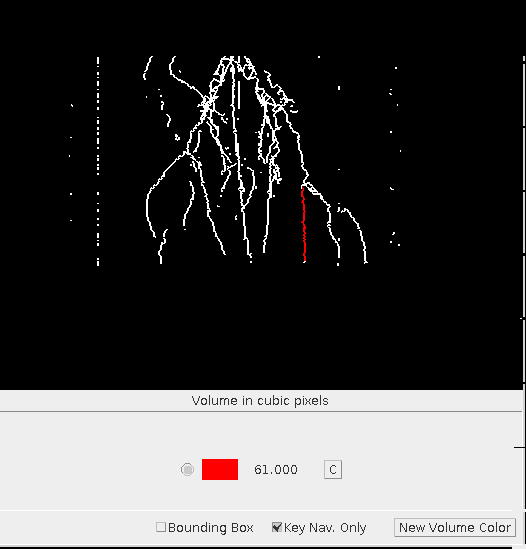 Figure 3. Selection of a line.
The selection of the lines (vessel segments in a vasculature) is performed entirely with mouse clicks. For the purpose of selection, lines (segments) are delimited by the end of a line and/or a line branching from it.
Selected lines are shown in the current measurement color; double clicking a line will change the color of that line and measure the volume based its corresponding voxels in the original, thresholded image (Figure 3). The voluem is shown next to the measurement color. The unit of measurement can be seen at the bottom of the image. Volume Calculator will attempt to find unit information in the image. If that is not possible, the unit of measurement is in voxels. Often a measurement will appear to be too short but rotating the image will show that selection stopped at a branch point - possibly very small. The algorithm used to calculate the volume is a variation of dilation (reverse skeletonization) that is bound by the voxels in the original image. Bifurcations and such are dealt with by sharing the voxels at the junctions.
The “C” button next to a color is used to reset all of that color’s lines to white. The volume is set to zero.
Another form of selection is to click a ponit on a line once and then click another line, elsewhere, once. The Volume Calculator will attempt to find a connected path between the two points. If that is possible, the path is changed to the measurement color and the volume of the entire path is calculated. If there is no connected path, a warning is displayed.
Grouping Measurements
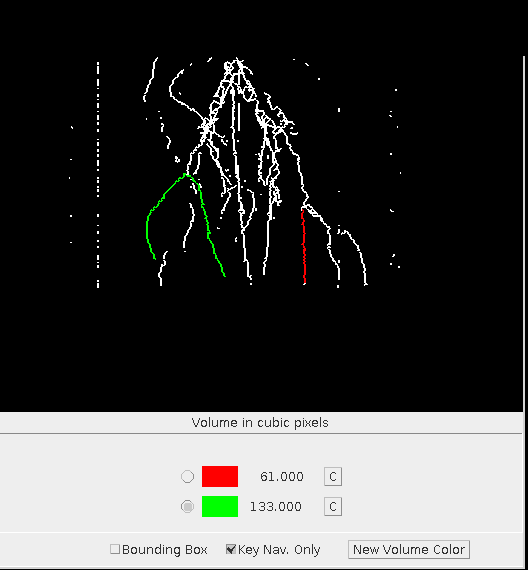 Figure 4. Two groups of measurements.
The Volume Calculator allows you to gather measurements into an arbitrary number of groups. The lines in each group are distinguished by the color given to them when they are selected for measurement. Initially there is only one color available: Red. It is shown, selected, in the bottom area of the window in Figure 3. To create another group of measurements, you push the New Volume Color button. A color dialog will be presented. Create a color and press OK. A new entry will appear with that color. The color will be automatically selected so that any new selections will be shown in that color. In Figure 4, a second color has been added and a measurement made.
The Volume Calculator keeps track of the what measurements are associated with a color. If you select a line with a color different from the measurement color, the volume of that line is subtracted from the original color total and added to the measurement color total.
References
The Volume Calculator plugin uses the following plugins:
- Skeletonize3D for performing the skeletonization,
- AnalyzeSkeleton for the analysis. Also tree traversal to create the Java 3D image is based on the one in this plugin.
- 3D Viewer for display and image manipulation.
License
Copyright (c) 2012, Peter C Marks and Maine Medical Center Research Institute All rights reserved.
Redistribution and use in source and binary forms, with or without modification, are permitted provided that the following conditions are met:
- Redistributions of source code must retain the above copyright notice, this list of conditions and the following disclaimer.
- Redistributions in binary form must reproduce the above copyright notice, this list of conditions and the following disclaimer in the documentation and/or other materials provided with the distribution.
THIS SOFTWARE IS PROVIDED BY THE COPYRIGHT HOLDERS AND CONTRIBUTORS “AS IS” AND ANY EXPRESS OR IMPLIED WARRANTIES, INCLUDING, BUT NOT LIMITED TO, THE IMPLIED WARRANTIES OF MERCHANTABILITY AND FITNESS FOR A PARTICULAR PURPOSE ARE DISCLAIMED. IN NO EVENT SHALL THE COPYRIGHT OWNER OR CONTRIBUTORS BE LIABLE FOR ANY DIRECT, INDIRECT, INCIDENTAL, SPECIAL, EXEMPLARY, OR CONSEQUENTIAL DAMAGES (INCLUDING, BUT NOT LIMITED TO, PROCUREMENT OF SUBSTITUTE GOODS OR SERVICES; LOSS OF USE, DATA, OR PROFITS; OR BUSINESS INTERRUPTION) HOWEVER CAUSED AND ON ANY THEORY OF LIABILITY, WHETHER IN CONTRACT, STRICT LIABILITY, OR TORT (INCLUDING NEGLIGENCE OR OTHERWISE) ARISING IN ANY WAY OUT OF THE USE OF THIS SOFTWARE, EVEN IF ADVISED OF THE POSSIBILITY OF SUCH DAMAGE.