SNT: Manual
| Home | Manual | Walk-throughs | Screencasts | Shortcuts | Rec. Viewer | Analysis | Scripting | Modeling | FAQ |
Contents
SNT Commands
SNT registers three commands in Fiji's menu structure in the Plugins › NeuroAnatomy › sub-menu:
- SNT...
- The main interface with all available commands with access to all viewers and canvases. Tracing and path editing operations are done from this interface.
- Rec. Viewer
- A fast, streamlined interface for analysis of existing neuroanatomical data.
- Reconstruction Plotter
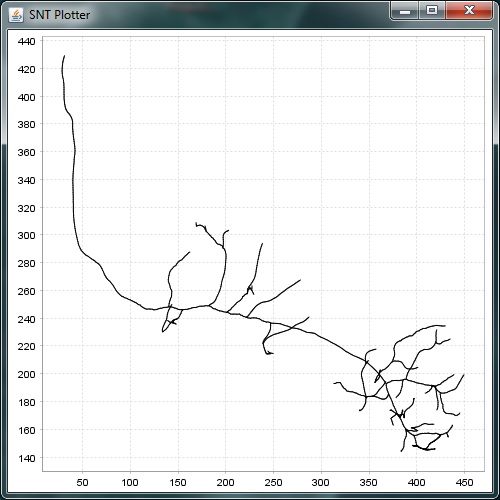
- A utility command for quickly render reconstructions in vector format without having to load other interfaces.
Startup Prompt
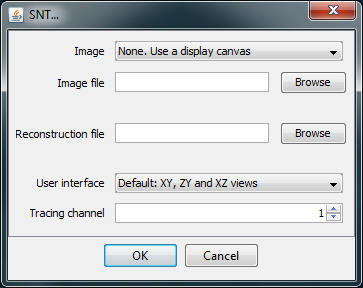
SNT is initialized by running Plugins › NeuroAnatomy › SNT.... All the options in the startup prompt can be set once SNT is opened, but the startup prompt provides the convenience of setting the most important parameters at once.
- Image/Image File The image to be traced/analyzed. The drop-down menu will list all images currently open in ImageJ. Alternatively, an image path may be specified by clicking Browse and choosing an image file. If no image is chosen, SNT will create an empty display canvas from the computed bounding box of the reconstruction file (if provided).
- Reconstruction file The path of the reconstruction file to be imported. SNT will automatically try to guess if there is a reconstruction file associated with the chosen image by looking at all the reconstruction files (.traces, .(e)swc, or .json) in the image directory, and choosing one that more closely matches the image filename.
- User interface Specifies which views to display for 3D images. The default setting provides the XY, ZY, and XZ views and allows for more accurate node placement but requires more RAM.
- Tracing Channel Specifies the image channel to trace on (this option is ignored with single-channel images).
Main Dialog
Menu Commands
File
Lists commands for I/O operations. Most are self-explanatory. Noteworthy:
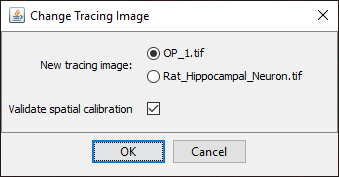
- Choose Tracing Image › Specifies the image to trace on without having to restart SNT. To trace on an image currently open in ImageJ, use From Open Image.... A prompt with the currently open images will appear, allowing selection of one. To browse for an image file, use From File.... You should toggle the validate spatial calibration checkbox to ensure the image to be imported is compatible with the existing one.
- Import › Labels (AmiraMesh)... This option assumes you are tracing on the same spatial coordinates of an annotated neuropil, for which compartments have been segmented (labeled) and stored in an Amira labels file. Once loaded, SNT will report the name of the compartments in the ImageJ status bar when hovering over the image.
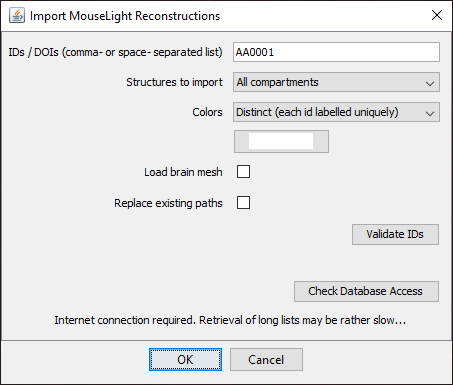
- Import › Remote Databases › Allows import of neuronal reconstructions from the FlyCircuit, MouseLight and NeuroMorpho remote databases.
- Export As › SWC › Allows export of all traced paths in the SWC file format, the most common format for representing neuronal reconstructions. Note that you can also export subsets of paths using the Path Manager.
- Save Measurements... Allows export of measurements generated by the Measure... and Quick Measurements commands in the CSV file format.
- Reset SNT and Restart... Resets all preferences and restarts SNT.
Analysis
- Path Order Analysis Produces a table and plot from morphometric statistics on the group of paths associated with each Branch Order. See [1] for details.
- Sholl Analysis... Brings up the Sholl Analysis dialog with a pre-defined set of focal points the user can choose from. See [2] for details.
- Sholl Analysis (by Focal Point)... Allows precise positioning of the focal point used by Sholl Analysis. See [3] for details.
- Strahler Analysis Conducts Strahler Analysis on existing paths, producing a table of analysis results and a Strahler plot. See [4] for details.
- Export CSV Properties... Allows export of information regarding individual Paths, including (but not limited to) morphometrics, neurite compartments, linkage relationships to other Paths and start and end coordinates.
- Measure... Provides a comprehensive selection of measurements to apply to one connected component (i.e., rooted tree structure) from the Path Manager. See [5] for details.
- Quick Measurements Shows a table with summary statistics for all existing paths. To measure only selected paths, use Analyze › Measure in the Path Manager. See [6] for details.
Utilities
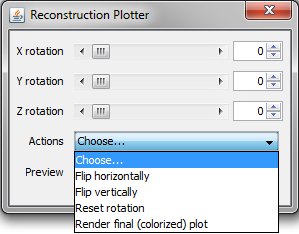
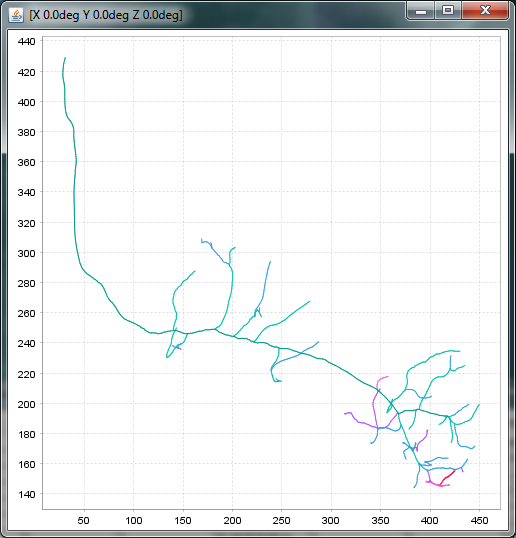
- Reconstruction Plotter... Plots a dynamic 2D projection of all existing paths. A control panel is included which allows adjustment of the spatial orientation of the tracing. If paths are assigned color tags, use Actions › Render final (colorized) plot from the control panel to render the (static) plot with color-mapped paths, with the final orientation matching that of the dynamic plot.
- Compare Reconstructions... Allows morphometric conparison of two single reconstruction files or multiple groups of reconstruction files. See Comparing Reconstructions for details.
- Create Dendrogram Generates a Dendrogram plot of a connected component (i.e, one rooted tree structure in the Path Manager). See Dendrogram Viewer for details.
- Batch Scripts › A collection of batch processing scripts related to image processing, reconstruction analysis and data curation. See Script Templates: Batch for details.
Scripts
See SNT: Scripting.
View
Contains commands for organizing tracing views on screen, plus commands for displaying cached data used for auto-tracing.
- Arrange Views Resets the view pane on-screen positions to their default.
- Hide Tracing Canvas › Allows toggling of the visibility of the three orthogonal view panes as well as the Legacy 3D View window.
- Show Cached Filtered Image Displays the cached filtered image in a separate window. Note a filtered image must be loaded in order to use this feature. The process of loading a filtered image is detailed in Generating Filtered Images.
- Show Cached Hessian Tubeness Image Displays the cached Hessian (Tubeness) image in a separate window. Note there are two ways to enable this feature. Either 1) enable Hessian-based analysis then run the Cache All Hessian Computations command from the "Auto-tracing" gear drop-down menu or 2) use the Load Precomputed "Tubeness" Image option in the same gear menu. These features are detailed in the "Auto-tracing" section of the Main Dialog overview guide.
Main Tab
This home tab aggregated widgets for tracing and frequent operations.
Cursor Auto-snapping
Enable Snapping checkbox If active (the default) the cursor snaps to the brightest voxel in its vicinity (Toggling shortcut: S). To accomplish this, SNT takes the cuboid of the specified dimensions (in pixels) centered on the current cursor position and searches quickly for local maxima in that neighborhood, moving the cursor to that position. The Z-plane in which the maximum was found is automatically selected if the "Z" parameter is greater than 0. Noteworthy:
- This feature assumes the signal is brighter than the background as typically found in fluorescent images.Error creating thumbnail: Unable to save thumbnail to destination
- If multiple maxima exist (e.g., when the signal is saturated), it snaps to their centroid.
- To streamline the computation: XYZ dimensions are constrained to even numbers and limited range.
- Snapping occurs in 2D (i.e., in the active plane) if Z=0.
- The XZ, ZY views are synchronized when 3D snapping is active (i.e., Z>0).
Auto-tracing
Enable A* search algorithm By default, SNT uses the A* search to automatically trace paths between two manually selected points. To manually place nodes in a path, toggle this feature off. Note that it is also possible to enable other algorithms through the installation of SNT add-ons. See Tubular Geodesics for details.
Hessian-based analysis (Toggling shortcut: H) A quick way to improve the quality and efficiency of the pathfinding is to enable this feature, in which paths are computed after filtering the image for tube-like structures. Upon such filtering, SNT will use a measure of Tubeness at each point of the image to define the best path through it, based on eigenvalues and eigenvectors of the Hessian matrix. The later can be used to infer the likelihood that a point in the image belongs to a tube-like structure. This concept is also known as vesselness or neuriteness.
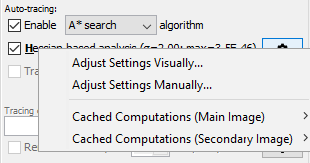
Hessian options (Specified in the gear drop-down menu) may be chosen Manually (if you already have a quantitative understanding of the image) or Visually (generally more intuitive). Hessian analysis requires two parameters to be specified:
- Sigma Controls the spatial scale of the filter. A lower sigma (σ) will capture small scale structure but is more sensitive to noise. A larger σ will consider larger scale structures but is less sensitive to local shape characteristics. It is generally advised to pick a value which reflects the average radius of the structures to be traced. It corresponds to the standard deviation of the 3D Gaussian kernel used to smooth the image prior to Tubeness filtering
- Maximum The maximum pixel intensity on the Tubeness image beyond which the cost function for A* search is minimized.
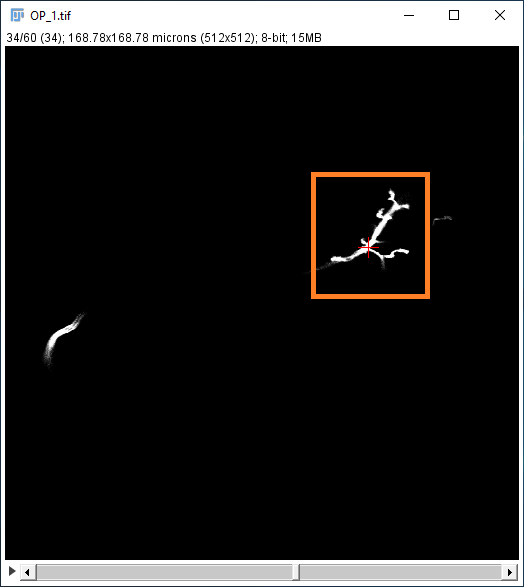
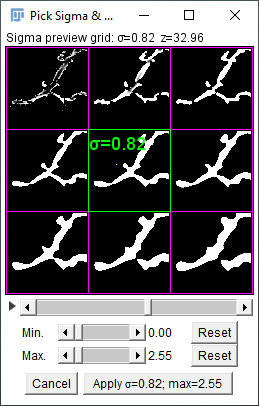
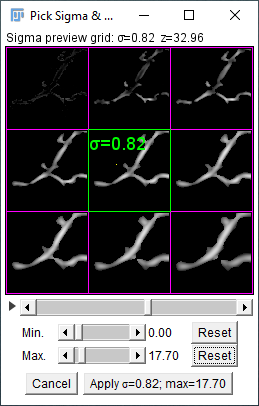
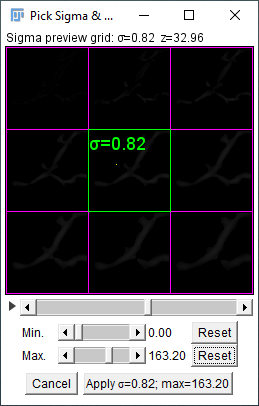
If you choose Visually, the dialog will prompt you to click on a representative region of the image which has meaningful structure. Once you click there, a 9-square palette is generated showing increasing values of sigma (from top-left to bottom-right) applied to that region of the image. The palette is an image stack which can be scrolled through with the mouse wheel.
| Adusting max | |||
| Oversaturated | Default | Undersaturated | |
| Choosing sigma and max. parameters visually for hessian analysis from a representative region in the image (orange box). With saturated max, the cost function for A* search is equivalent across the signal. Also, note how lower sigma values cause the axon to be dimmer on the center and brighter on the edges, while higher sigma values eliminate detail from the structure. | |||
Experiment with different Adjusted max. values to find a setting which captures the structures you are interested in while taking care to avoid over or under-saturation. In the former case, the search might consider pixels outside of the tubular structures, giving a less accurate result. In the latter case, the search might take significantly longer, since each pixel will carry greater cost than is reasonable. It is usually safe to choose a value somewhere near the default. Once you have chosen this value, click on the square in the palette with the sigma that best fits your application (its border will turn green) then press "Apply". The parameters will be transferred to the interface and a Gaussian convolution will be run over the image, which may take some time depending on its size. Once it's done, pathfinding will occur on the Hessian (a.k.a. Tubeness) image.
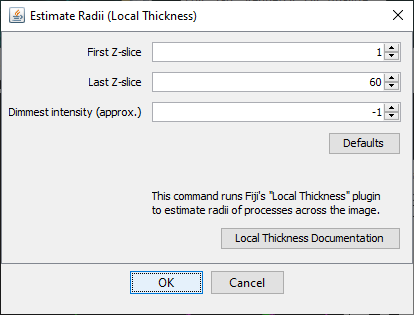
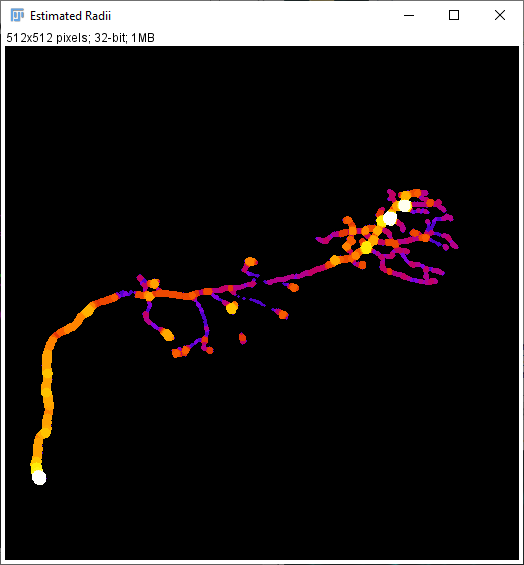
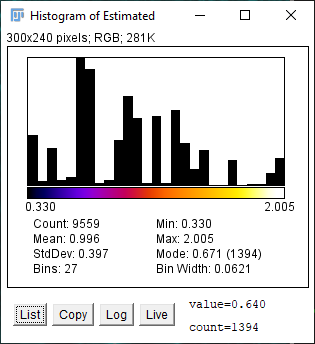
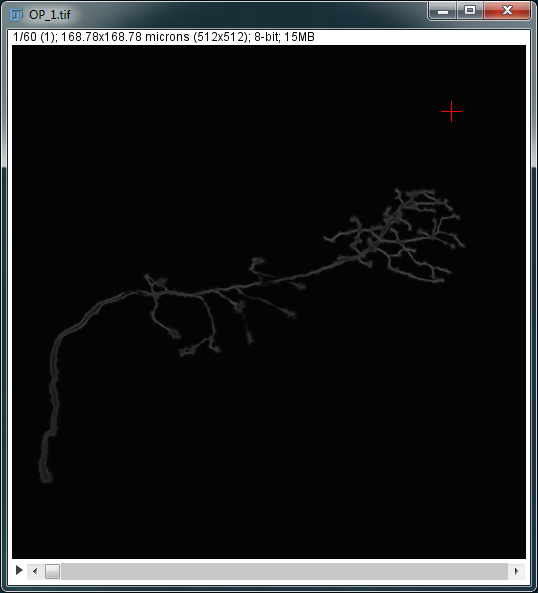
The Estimate Radii (Local Thickness)... option in the Hessian gear menu will run the Local Thickness (complete process) plugin found in Analyze › Local Thickness › Local Thickness (complete process) in the main Fiji dialog. This allows automated radii estimation of processes across the image, which can inform the choice of sigma. The user can set the Z-slice range for the analysis to consider, as well as the pixel intensity threshold (pixel values below the threshold are treated as background).
The parameters are:
- First Z-slice The starting slice of the image to be considered in the estimation.
- Last Z-slice The end slice of the image to be considered in the estimation.
- Dimmest intensity (approx.) Pixel values below this value are treated as background when computing the distance map. Use -1 to adopt the default cutoff value (half of the image max).
Pressing OK will output a color-mapped image (based off local radius) and a histogram showing the distribution of radii across the image. To calibrate the Hessian analysis for smaller processes, one might select a sigma value closer to the minimum estimated thickness, or the opposite for larger processes.
Other options are also available in the gear drop-down menu:
- Cached Computations (Main/Secondary Image) By default SNT computes the Hessian matrix on a "compute-as-you-go" basis, which saves memory but increases the pathfinding time. If you have enough RAM, you can use this set of options to compute the matrix once for the full image and cache the result, which in certain cases, can lead to almost-instantaneous searches. Note that this computation adopts the current values of sigma and max. reported in the widget, so you should adjust those before running this command.
- Flush Cached Data Removes cached data from memory
- Show Cached "Tubeness Image" Displays the Tubeness data currently cached. Useful for debugging purposes. Also mirrored in View › Show Cached/Loaded Hessian (Tubeness) Image.
Tracing on Secondary Image
This is one of SNT's most advanced features. Hessian-based analysis provides a convenient and easy way to perform auto-tracing on pre-processed data in which voxels defining the traced structure are scored by their likelihood of belonging to a tube-like structure. However, it is just one approach for "tubeness" classification. What if your data requires different filtering?, or you want to experiment with other approaches?, or the perfect pre-processing algorithm for your images is not yet available in ImageJ? Tracing on Secondary Image is the answer to these questions: It allows you to feed SNT with pre-processed data on which the A*star search will operate. Here are two specific usages for this option:
- Frangi Vesselness filtering For certain datasets Frangi filtering (Frangi et al. 1998) is more effective than Tubeness at enhancing tube-like structures in the image. However, it is more computation intensive, and thus, less suitable to be adopted by the "compute-as-needed" approach used in Hessian-based analysis. Thus, one can import a pre-computed Frangi-filtered image using this option.
- Hessian-analysis at multiple scales Let's consider a structure formed simultaneously by very thick and very thin processes (e.g. axons and dendrites). To trace it one would need to adjust continuously the sigma parameter while tracing. Instead, to trace structures of variable diameters more effectively, one could load a copy of the current image as secondary image, and assign different hessian parameters to both images.
- Adopting probability maps Pre-classified images (using e.g., machine learning) could also be loaded here.
Importantly, this option can be toggled at will, during tracing. Indeed, one can ping-pong between secondary image and main image simply, by pressing I, the shortcut for the Trace on Secondary Image checkbox.
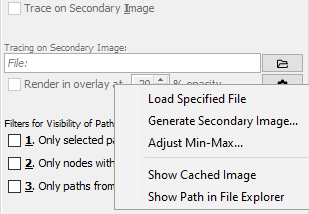
Secondary Image options can be specified in the gear drop-down menu, including commands for Loading/displaying the image file and the powerful Generate Secondary Image command:
- Load Specified File Loads the filtered image specified in the File textbox.
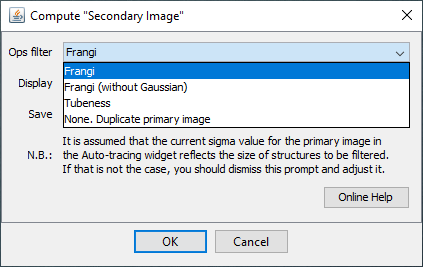
- Generate Secondary Image Enables processing of the currently open image directly from SNT. Three routines are currently supported: Frangi, Frangi (without Gaussian) and Tubeness. Supports saving and display of the resulting image. To use the currently open image as the secondary image, choose None. Duplicate Primary Image. Noteworthy: It is assumed that the current sigma value in the Auto-tracing widget reflects the size of structures to be filtered. If that is not the case, the sigma should be adjusted before running this command.
- Adjust Min-Max Sets the range of pixel intensities used by A* search.
- Show Cached image Displays the currently loaded filtered image in a separate window.
- Show Path in File Explorer Opens the directory containing the filtered image specified in the File textbox in the File Explorer GUI.
See the Generating Filtered Images walk-through for more details.
Filters for Visibility of Paths
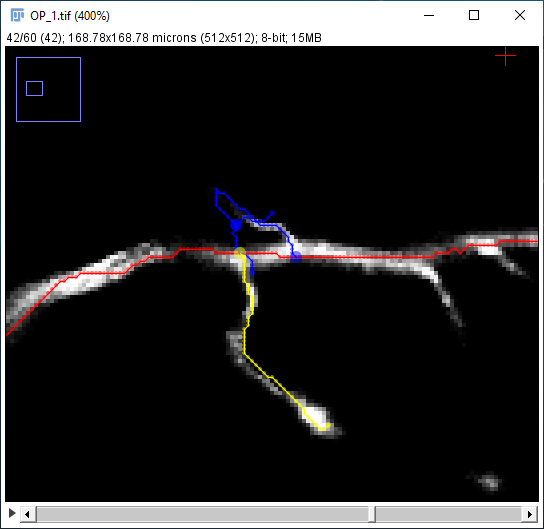
By default, all the nodes of a path are projected onto the current Z-slice. This is useful to see how much has been completed and gives a sense of the overall structure of the reconstruction. However, SNT provides three additional visibility options for paths:
- Only selected paths (hide deselected) Only show paths that have been manually selected in the Path Manager or with the G key (⇧ Shift+G to select multiple paths).
- Only nodes within {x} nearby Z-slices Only highlight nodes within {x} number of Z-slices on either side of the current slice. The projected skeletons of all paths remain visible.
- Only paths from active channel/frame If tracing on a multichannel image or an image with a time axis, only show paths from the active channel or frame.
Any combination of these options may be toggled simultaneously. Note that these options do not apply to Rec. Viewer and SciView.
Default Path Colors
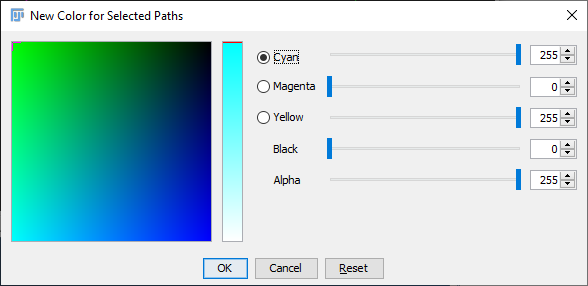
By default, finished paths are colored by their selection status (only selected paths can be edited, or extended). The default colors are Green (selected paths) and Magenta (deselected). Default colors can be customized by pressing the respective button in the widget and using the CMYK color chooser. For customizing unconfirmed and temporary paths, see the Colors option in the UI Interaction widget.
Enforce default colors (ignore color tags) If active, SNT will force all paths to conform to the default "Selected" and "Deselected" color buttons. Any custom color tags will be ignored until the option is toggled off. Note that this options does not apply to Rec. Viewer and SciView.
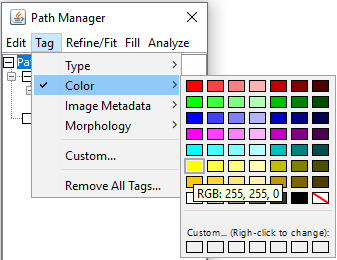
Tip: The Path Manager offers several ways to colorize Paths: 1) Using Tag › Color swatches (custom colors can be temporarily assigned to empty swatches, by right-clicking on them) or 2) Using Analyze › Color Coding..., providing morphometric-based color mapping. Note that Path Manager commands are applied to all paths if no paths are selected.
Options Tab
This tab aggregated widgets for advanced settings.
Data Source
If tracing on a multi-dimensional image (i.e., one with multiple data channels and/or a time axis), a particular channel/frame can be loaded into the views by selecting each and pressing the "Reload" button.
Views
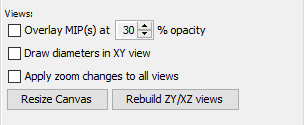
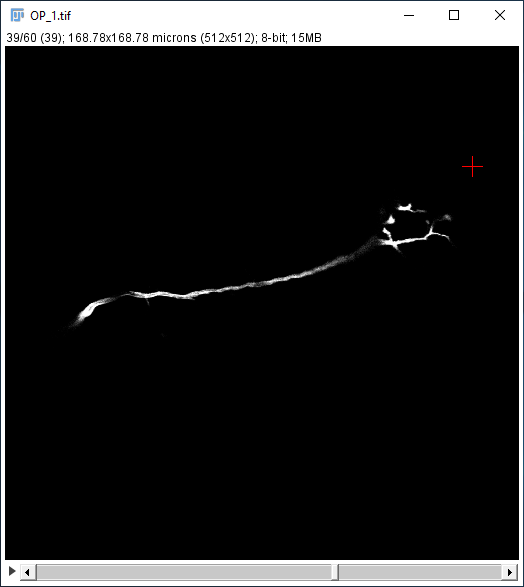
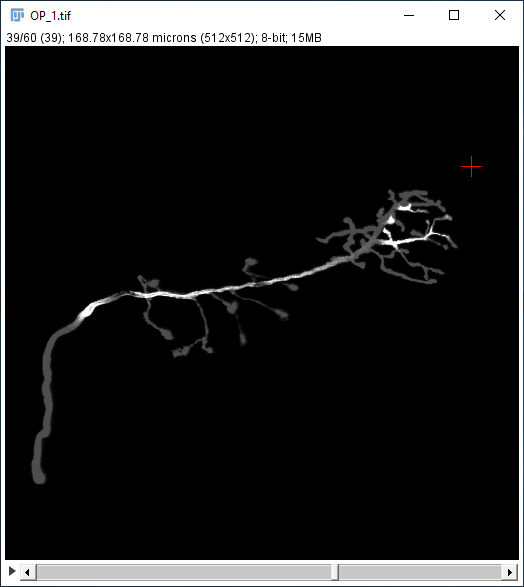
- Overlay MIP(s) at X% opacity Overlays the Maximum Intensity Projection of the image "over" the image canvas at the specified opacity. The overlaid projection is only used as a visualization aid and is ignored by the auto-tracing algorithms. It is rendered using the LUT of the channel currently being traced. To reload the overlay (e.g., in case the image being traced changes during a tracing session) toggle the checkbox twice.
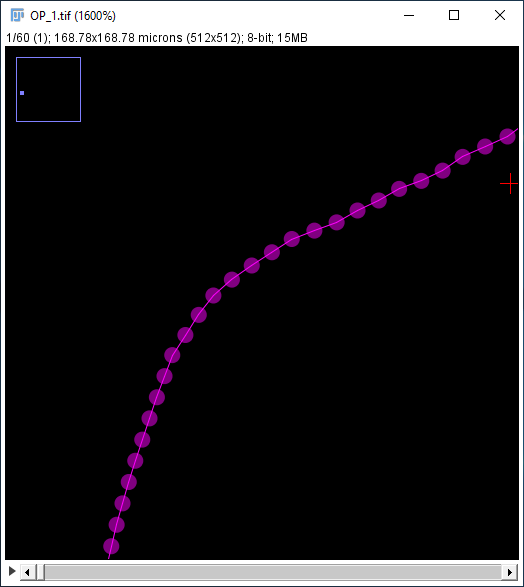
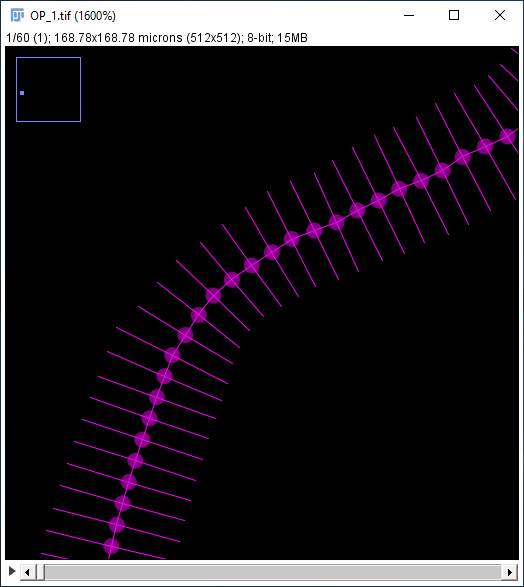
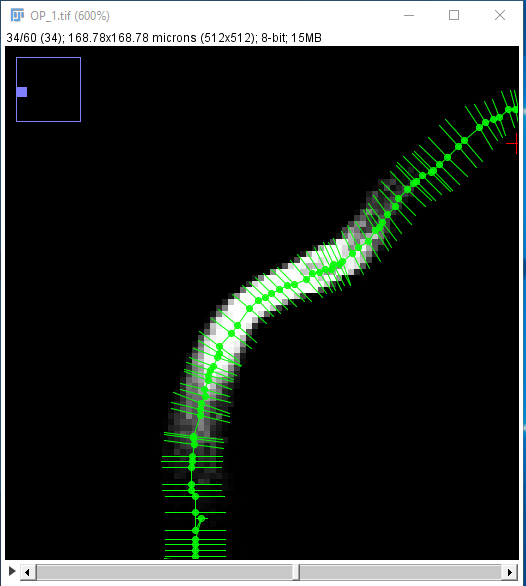
- Draw diameters in XY view Displays the stored diameter (if any) in the XY view for all existing nodes. Each diameter is drawn as a line segment with length = diameter, which is bisected by the orthogonal tangent vector to the path at that node.
- Apply zoom changes to all views If a zoom change is applied to any one of the XY, ZY or XZ views, apply the same change to the two other views if they are open. Since in ImageJ zooming may resize the image window, you can use Views › Arrange Views to reset their positions
- Resize Canvas If using a display canvas to view reconstructions, reset its dimensions to the default. (Currently, this command is only available for display canvases, to resize an image go to IJ's command Image › Adjust › Canvas Size...
- Display ZY/XZ views If currently using the XY only view, display the ZY and XZ views as well.
Temporary Paths
- Confirm temporary segments If active, prompts for either confirmation or denial of whether or not to keep an unconfirmed path segment. If inactive, automatically confirms the path segment created on each subsequent node placement after starting a path. Applies to both auto-traced and manually traced path segments. The following two settings are only toggle-able when this setting is active.
- Pressing 'Y' twice finishes path Finish a temporary path on two successive Y key presses.
- Pressing 'N' twice cancels path Discard a temporary or unconfirmed path, including the start node, on two successive N key presses.
UI Interaction
- Colors Specifies how components should be rendered, including:
- Canvas annotations The label shown on the top-left corner of the views indicating the state of the UI ("Tracing Paused", "Choosing Sigma", etc.)
- Fills The pixels that have been reached by the Fill search
- Unconfirmed and Temporary paths.
- Path nodes rendering scale Adjusts the radius of the drawn circles representing path nodes. A path node is rendered as a circle centered at the XYZ coordinate of the point annotation. The default scale is inferred from the current zoom level.
- Activate canvas on mouse hovering If active, moving the mouse cursor over the any of the views automatically brings the view window into focus, allowing it to receive input.
Misc
- Skip confirmation dialogs If active, disables the "Are you sure?" prompt preceding major actions. Note that this option does not apply to irreversible actions such as deleting paths.
- Debug mode If active, logs detailed information about actions in the console.
- Preferences... Allows setting other options, namely:
- Whether the position of dialogs should be remembered across restarts
- Whether Gzip compression (lossless) should be used to reduce the storage footprint of ".traces" files.
- The max number of parallel threads to be used by SNT, as specified in ImageJ's Edit › Options › Memory & Threads...
- Reset All Preferences... Resets all options to their default values. A restart of SNT may be required for changes to take effect.
3D Tab
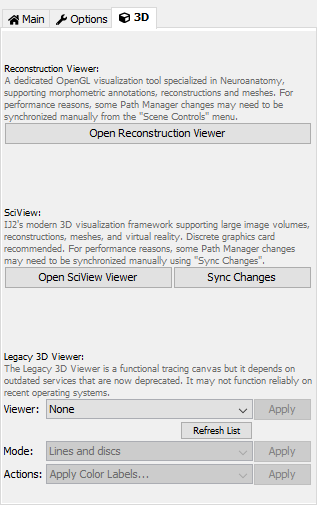
This tab aggregates widgets related to 3D interaction.
Reconstruction Viewer
The Reconstruction Viewer is an advanced, fully scriptable OpenGL viewer enabling 3D visualization and interaction with reconstructions, OBJ meshes (including multiple model organism neuropil annotations and reference brains), computed surfaces (convex hulls) and other shape annotations. For performance reasons, some Path Manager changes may need to be synchronized manually from the RV controls. To open Reconstruction Viewer with the current contents of the Path Manager, press Open Reconstruction Viewer. To instead open the viewer as a standalone application, go to Plugins › NeuroAnatomy › Reconstruction Viewer... in the main Fiji dialog.
SciView
SciView is IJ2's modern replacement for the Legacy 3D Viewer, providing sophisticated 3D visualization and virtual reality capabilities for arbitrarily large image volumes and meshes. Since it is fully integrated with SNT, SciView can enhance tracing, analysis and visualization routines by providing a deeper, more contextualized view of the imagery at hand. Additionally, native integration with Cx3D enables simulation of neurodevelopmental processes, including neuronal growth and formation of cortical circuits. See SNT: Modeling for details.
Legacy 3D Viewer
The Legacy 3D Viewer is a functional tracing canvas but it depends on outdated services that are now deprecated. It may not function reliably on recent operating systems. For usage instructions, see Tracing using the Legacy 3D Viewer.
Contextual Menu
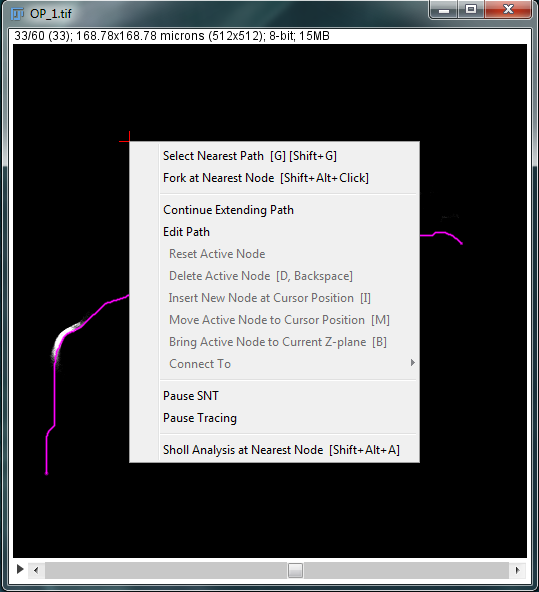
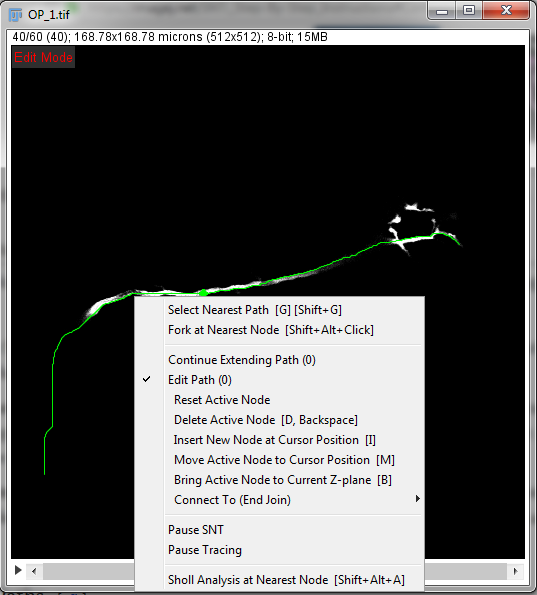
Right-clicking on any of the image views will bring up a menu with various editing tools. The corresponding keyboard shortcuts are shown to the right of each option.
- Select Nearest Path G or ⇧ Shift+G Will select the path closest to the mouse cursor.
- Fork at Nearest Node ⇧ Shift+⎇ Alt+Left Click Creates a fork point at the node closest to the mouse cursor. Once a fork point is made, the branch may be extended as described in Step-By-Step Instructions.
- Continue Extending Path Allows continued tracing of previously finished paths. Note only one path may be extended at a time. To extend a path: first select it, choose this option, then place additional nodes as shown in Step-By-Step Instructions.
- Pause SNT Waives all keyboard and mouse inputs to ImageJ, allowing you to interleave image processing routines with tracing operations. Note that if the image contents change while SNT is paused, the image should be reloaded so that SNT is aware of the changes. Tracing views are annotated with the SNT Paused label to indicate this state.
- Pause Tracing Disables tracing functions until this option is deselected. Tracing views are annotated with the Tracing Paused label to indicate this state.
- Sholl Analysis at Nearest Node ⇧ Shift+⎇ Alt+A Runs the Sholl Analysis plugin found in Analyze › Sholl › Sholl Analysis (From Tracings). Note the Center parameter, which sets the center point of the analysis, is left out as this value is given by the selected node.
Editing Paths
Pressing Edit Path with a single path selected will activate Edit Mode, allowing use of the menu options under the Edit Path option. When Edit Mode is active, moving the mouse cursor along the path will activate the nearest node and synchronize the current Z-slice to the location of that node. Note that the ability to create new paths is temporarily disabled when in Edit Mode.
- Reset Active Node Clears the active node from the cursor.
- Delete Active Node D or ⌫ Backspace Permanently removes the active node from the path.
- Insert New Node At Cursor Position I Inserts a new node at the cursor position. The inserted node is placed between the active node and its parent.
- Move Active Node to Cursor Position M Moves the active node to the cursor position.
- Bring Active Node to Current Z-plane B Moves the active node to the active Z-plane. Note that the translation is only done in Z. XY positions are unchanged.
- Connect To (Start Join) Allows two existing paths to be merged or joined.
Path Manager
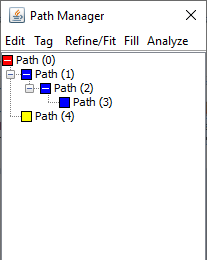
The Path Manager dialog displays all existing paths in a hierarchical structure (tree), where one path is "primary" (path 0) and all other paths (paths 1...N) are children of the primary path. The dialog also contains several menus with various editing, tagging, refinement/fitting, filling and analysis options. Paths can be searched by name and/or tags in the text filter, with more sophisticated search capabilities in the Advanced Filtering Menu.
Menu Commands
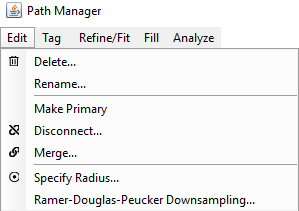
Edit
- Delete... Removes selected Path(s) from the Path Manager. If no Paths are selected, all Paths are deleted.
- Rename... Renames the selected Path. Only one Path may be renamed at a time.
- Make Primary Makes the selected Path the primary Path, moving it to the top of the tree hierarchy. Note that this will alter parent-child relationships between Paths and, by consequence, individual nodes.
- Disconnect... Disconnects the selected Path from all of its connected Path(s) (Undoable operation).
- Merge... Merges the selected Paths (at least two) into one. Note the starting node of Path i is merged to the endpoint of Path i+1.
- Specify Radius... Assigns a constant radius to all the nodes of selected Path(s). This setting only applies to unfitted Paths and overrides any existing values.
- Ramer-Douglas-Peuker Downsampling... Given an inputted maximum permitted distance between adjacent nodes, performs Ramer-Douglas-Peucker downsampling on the selected Path(s).
Tag
Assigns tags to Paths. Tags are organized in the following categories:
- Type › Type of neurite compartment (Axon, (Basal) Dendrite, Soma, etc.), as used by the SWC file format. It is also possible to pair each type with a color tag through the Tag › Options.. dialog
These tags are considered to be essential annotations and all paths are assigned the Undefined-type tag when created. For this reason they are not eliminated by the Remove All Tags command. - Color › A preset swatch color, or a custom one chosen from the color chooser (right-click on a blank swatch). Note it is also possible to assign a metric-based color mapping using the Analyze › Color Coding... command.
- Image Metadata › Information on hyperstack position details (e.g., channel, frame or slice labels on which a path was traced).
- Morphometry › Morphometric properties, such as Path length, Path mean radius or Path order.
- Custom... Ad-hoc comments.
Note that only SWC-type tags are preserved across restarts when saving traces in the SWC format. All others require data to be saved in SNT's own .Traces format.
Refine/Fit
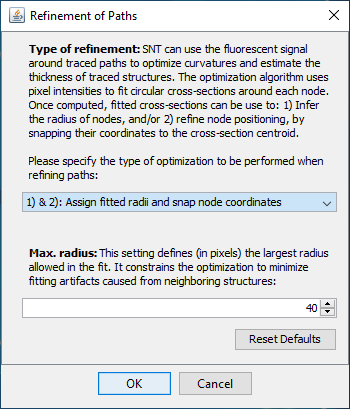
SNT can use the fluorescent signal around traced Paths to optimize curvatures and estimate the thickness of traced structures to sub-voxel accuracy. The optimization algorithm uses pixel intensities to fit circular cross-sections around each node. Once computed, fitted cross-sections can be used to: 1) Infer the radius of nodes, and/or 2) refine node positioning, by snapping their coordinates to the cross-section centroid. The Refine/Fit › menu contains three entries:
- Fit Path(s).../Un-fit Path(s)/Apply Existing Fit This option will change depending on which Path(s) are currently selected. You can use it to 1) Fit selected Path(s), 2) un-fit Path(s) that have already been fitted, or 3) apply a generated preview of the fit or an existing fit.
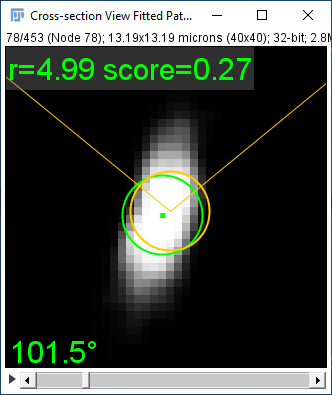
- Explore/Preview Fit Carves out a region of the image along and around each Path node, generating an animated cross-view "fly-through" with the result of the fitting operation. The generated image is annotated with details of the fit: i) Fitted radius; ii) normalized score quantifying the "circularity" of a node's cross section, and iii) the angle between node and parent tangent vectors.
- Discard Fit(s)... Deletes the existing fit(s) for the selected Path(s), or all fits if no Paths are selected.
Before computing the fit, SNT will prompt you to specify two parameters:
- Type of Refinement: Either 1) Assign radii of fitted cross-sections to nodes, 2) Snap node coordinates to cross-section centroids, or 1) & 2) Assign fitted radii and snap node coordinates
- Max. Radius Defines (in pixels) the largest radius allowed in the fit. It constrains the optimization to minimize fitting artifacts caused by neighboring structures. A good rule of thumb is to use 1.5-2x the largest radius in the traced structure. Default is 40 pixels on each side of the path
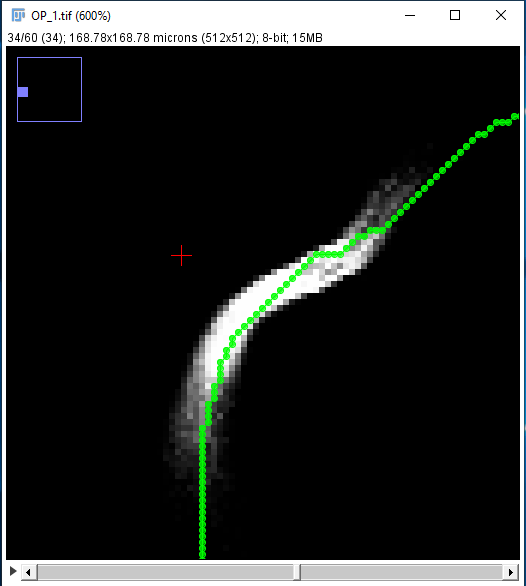
Assuming you chose to fit both centroids and radii, a fitted path might look like the rightmost image below. Notice how the nodes follow the center line of the structure more closely, and how each node now has a non-zero radius approximating that of the traced axon.
Fill
- Fill Out... Begins the filling process for selected paths. For detailed instructions see Filling: Step-By-Step Instructions.
Analyze
This menu contains several options which provide quick ways to analyze and visualize numerical properties of paths. Note that these operations are only applied to the subset of currently selected Path(s). To apply these operations to the entire Tree, deselect all Paths first.
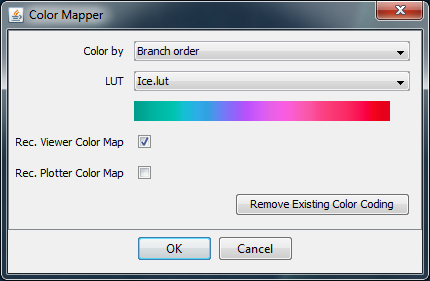
- Color Coding... Assigns color codes to paths based on the chosen metric.
- Color by Drop-down menu containing the metrics which inform the color mapping.
- LUT Drop-down menu containing the LUTs (Look Up Tables) that define the color palettes. The LUTs are those that come packaged with ImageJ. The selected LUT is displayed in the color bar directly underneath.
- Rec. Viewer Color Map If active, opens an instance of the Reconstruction Viewer with the selected paths color coded with the selected LUT.
- Rec. Plotter Color Map If active, open an instance of the Reconstruction Plotter with the selected paths color coded with the selected LUT.
- Remove Existing Color Coding Removes existing color coding from the selected paths.
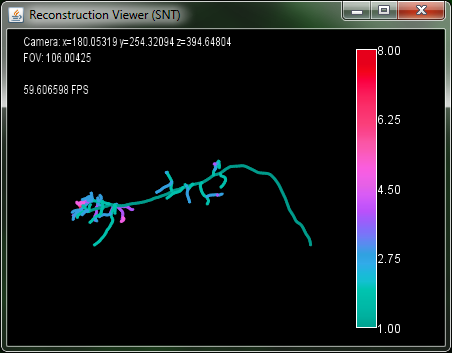
| After choosing metric: Branch Order, LUT: Ice, showing the Reconstruction Viewer with the color-mapped OP_1 tracing. | |
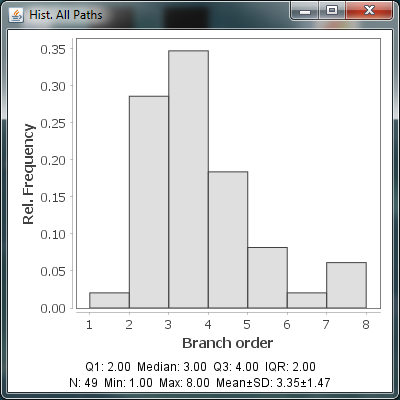
- Distribution Analysis... Plots a histogram of the selected metric.
- Measurement - Drop-down menu with the available metrics.
| Choosing Branch Order for the measurement. | |
- Measure.../Quick Measurements Shows a table of summary statistics for selected paths. The former command allows for specific selections of metrics. If measuring multiple tracings, the table can be sorted by column.
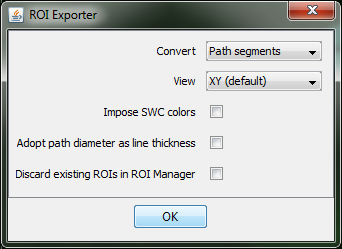
- Convert to ROIs... Allows conversion of Path(s) to ImageJ ROIs (Regions of Interest). Creates an instance of the ROI Manager
- Convert Drop-down menu specifying the compartment to convert.
- View Drop-down menu specifying which view to overlay the ROIs.
- Impose SWC colors
- Adopt path diameter as line thickness
- Discard existing ROIs in ROI Manager
| Converting paths to ROIs with the default parameters. | |
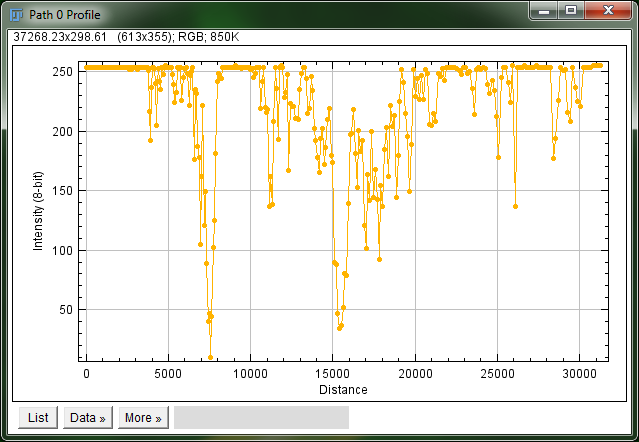
- Plot Profile Uses the pixel intensity values under point annotations to generate a pixel intensity vs. distance (from the start node of a Path) plot for selected Path(s).
| Intensity profile for Path 0 of OP_1. | |
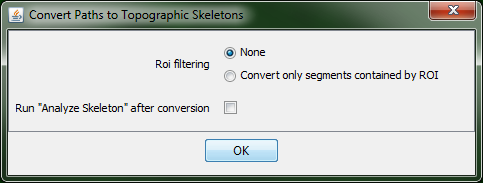
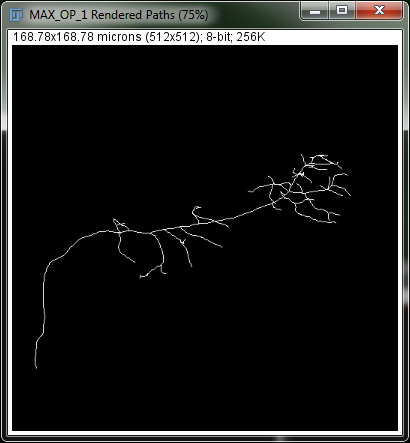
- Skeletonize... Outputs a binary image that is a topographic skeleton, ie, it generates an empty (zero-filled) image of the same dimensions of the one being traced, then paints a pixel at each node coordinates following the topographic rules of bitmap skeletons in which fork points, tips and slab voxels are determined by voxel connectivity.
- Roi filtering
- None
- Convert only segments contained by ROI
- Run "Analyze Skeleton" after conversion Runs the AnalyzeSkeleton plugin on the skeletonized output image.
- Roi filtering
| Converting paths to a topographic skeleton with default parameters. | |
- Save Subset as SWC... Exports the selected subset of Path(s) as an SWC file. Note the paths to be exported must include a primary path (i.e., one at the top level in the Path Manager hierarchy).
Filter Toolbar
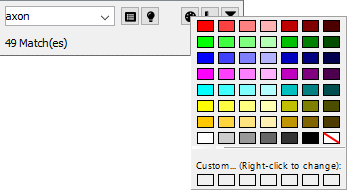
The filter toolbar allows paths to be searched and filtered quickly using tags (colors, annotations, SWC-type, etc.) or morphometric properties. The text field is used for text-based searches (recent searches can be recovered through its drop-down menu). The ↓ and ↑ arrow keys find the next/previous occurrence of the entered phrase, while the- Color Filters Error creating thumbnail: Unable to save thumbnail to destinationAllows filtering of Paths by color tags. Custom colors may be selected by right-clicking an empty swatch, which will bring up the CMYK palette. The chosen color is temporarily saved in that swatch.
- Morphology Filters Error creating thumbnail: Unable to save thumbnail to destinationAllows filtering of Paths by selected morphological properties (including cell identity). Note that these filters do not require Paths to be labeled using Tag › Morphology › .
- Path Order... Filters for Paths of Path order in the inputted range. Example queries: 1-2: selects all primary and secondary branches; max-max: selects all terminal branches.
- Length... Filters for Paths of length within the inputted range. Example queries: 10-20: selects all Paths with lengths between 10 and 20μm; max-max: selects the longest path(s).
- Mean Radius... Filters for Paths of mean radius within the inputted range.
- No. of Nodes... Filters for Paths with node count within the inputted range.
- SWC Type... Filters for Paths with the selected SWC type tags. Note that the Paths of interest must have been tagged using theTag › Type › menu.
Fill Manager
Provides controls for all filling operations. It is described in more detail in the Filling: Step-By-Step Instructions.
| Home | Manual | Walk-throughs | Screencasts | Shortcuts | Rec. Viewer | Analysis | Scripting | Modeling | FAQ |
