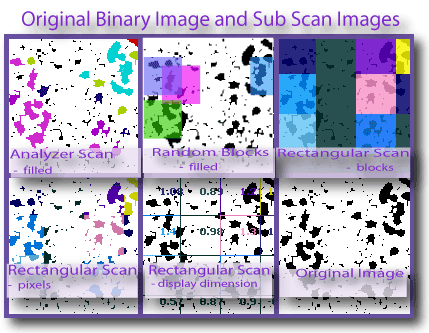
Colour coded graphics are generated when the option to make them is selected on the setup panel for certain scans:
- RoiManager scans,
- subscans,
- LCFD scans, and
- particle analyzer scans.

The Colour Tree

The colour selection tree lets you choose a preset array of colours for colour-coding graphics files and fine tune the model to fit your data. To select a model, click one of the colour sets, and the popup dialog appears with that basic model loaded, so you can modify it to fit your data.
- Where is the tree? How do I find it? The colour tree, as shown in the image, appears and, if closed, reappears automatically if the selected scan uses colour-coding. If it disappears, click on a set up button on the FracLac panel and make sure the option to show colour coded graphics is selected.
- How do I preview a colour scheme? The schemes available are displayed on the colour tree. If they are not displayed, click the COLOURS node at the top to open the tree. See also making Custom Colour Schemes. Hover your mouse over the image for an illustration.
- How do I select a colour scheme? Before doing a scan, click on the tree to select it, then scroll through the colours, and click the number beside the colour scheme you want on the tree. If you hover your mouse over the image of the colour tree shown here, you will see a scheme selected, highlighted by the purple box. Note that you can also select one from the Graphics Options dialog box that appears during scans.
Graphics Options Dialog
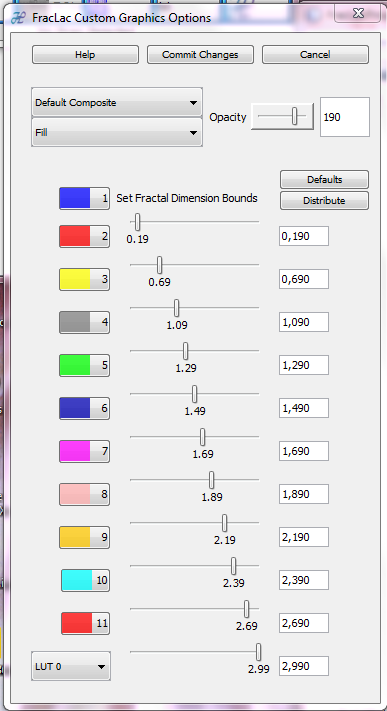
Use the Colour Coding Set-Up Dialog to change the opacity, composite type, fractal dimension ranges, and colour scheme.
-
How do I make the Graphics
Options dialog appear?
- It appears when you click on the Colour Tree
- It appears when you click a setup button for a scan type that has a check box for showing colour-coded graphics and select the check box
- It appears anytime you change options within such a scan
- It appears dynamically after a scan and lets you adjust settings and see them in real time if you selected to show colour coded graphics AND you are doing an onscreen scan of a single slice.
- How do I use the dialog?
- How do I change opacity for colour-coded images? Change the opacity of colour-coded images using the OPACITY slider in the Graphics Options Dialog. Move it to the right to completely cover pixels; to the left to reveal them more in the final graphics files.
Basics
How to use the panel:- Decide what you are using it for. Set the values ahead of time for a batch job or stack, or adjust the values in real time for a single slice test run.
- Set it up. Start with a default or select a new LUT from the dropdown.
- Adjust the boundaries for each range of DFs you wish to visualize.
- Modify the colours by clicking on each button.
- Choose a display method.
- Adjust the transparency by using the Opacity slider or text box.
- Set your model by clicking Commit Changes
- Use your committed model by scanning with colour coding turned on.
Tips
- To inspect trends, set the upper and
lower bounds and colours.
- For instance, if your image has something interesting going on in areas with fractal dimension around 1.4, you can investigate that range by setting the lower limit to 1.3 and the upper to 1.5, clicking the Distribute button, and selecting a range of colours that contrast to highlight the variation.
- To show only a certain range, set the buttons above and below the range all one colour or those above one colour and below another.
- To distribute DFs
between a minimum and maximum, use the
Distribute button.
- Set the top and bottom sliders or text boxes to the values you want, then click Distribute.
- After you click the button, you will be given a choice to distribute between the current values the sliders are at and the last stored range from a scan.
- To reload the default array, select the Defaults button.
- The composite dropdown is for adjusting how images are drawn over.
- Set up for your particular image set.
- The panel loads with default values, but these may not reflect the information you are interested in for your images, so you may need to do some preliminary screening to find suitable colours, fractal dimension ranges, transparency values, and display methods.
- You can manipulate these variables and see the results immediately only for single slice images that are on screen at the time.
- To use it for batch jobs and multi-slice stacks, you will want to do preliminary scanning on single slice images on the screen, to find out the relevant ranges.
Customize the LUT
- Use the panel to modify the look up table (LUT) used to colour code scanned images according to the distribution of fractal dimensions (DFs).
- The LUT is a map relating fractal dimensions for parts of an image to colours. The colours are displayed as buttons in the dialog, along with sliders for their fractal dimension ranges. (See the image at the top of the page for examples of colour coded images).
- To change a colour, click on the button and a colour chooser will pop up. Select a new colour or cancel to leave it unchanged.
Real Time Changes
There are 2 ways to apply changes, one in real time and the
other ahead of time.
To change settings and see how they look in real time,
you have to be doing a scan of a single slice image,
and it has to be on screen. For slices and batch jobs,
you must set up the colours and
method ahead of time.
See tips.

Coding Method
- Select a coding method from the drop down.
- Fill: fills each region entirely with the colour, transparency, and composite selected
- Draw: outlines the region with the colour, transparency, and composite selected
- Text: outlines the region and writes the fractal dimension in the centre of it
- Replace Foreground Pixels: for binary scans only, this method replaces the foreground pixels only for each region with the colour, transparency, and composite selected
Adjusting Ranges
The panel shows a set of colour buttons and beside each a number (i.e., a fractal dimension or DF) on a slider. The DFs are boundaries for each colour; all parts of an image with a DF between two sliders will be coloured using the colour for that range. So, if consecutive sliders are set to 1.290 and 1.490 and the corresponding colour is green, areas on an image with a DF greater than 1.290 and less than 1.490 will be coloured green. A number is put in a bin if it is less than the limit, to three decimal places (e.g., if 1.290 is a limit, 1.299 falls not into the bin before 1.290, but into the bin after it).
Default Ranges
To load the panel with a set of default ranges, click the Defaults button.
Automatically Distributing Ranges
If you know the minimum and maximum fractal dimensions you are interested in visualizing and you want a regular distribution, FracLac can automatically generate a distribution of fractal dimensions for you.
- When you scan an on-screen stack having only one slice, as soon as the colour coded image appears when the scan is done, a popup appears asking if you want to change the colours. It displays the fractal dimension range it will use, which is based on the minimum and maximum values from the scan.
- When you use the panel to set or change options, you can click the Distribute button, and this brings up a popup asking if you want to use the slider values or the last stored scan's values.
Committing Changes
When you like the colours, range, etc., click the Commit button to save your changes. NB: If you do not hit the Commit Changes button, alas, your changes are ignored. Cancelling or closing the colour options panel (e.g using the top right X icon) erases your model.