Simple Neurite Tracer: Sholl analysis
Introduction
This tutorial assumes that you've already traced an image with Simple Neurite Tracer (SNT) and that you are familiar with the variants of Sholl methods and the Sholl Analysis plugin. This tutorial will use an olfactory projection fibre image, freely available from the Diadem challenge data set.
Retrieving Profiles
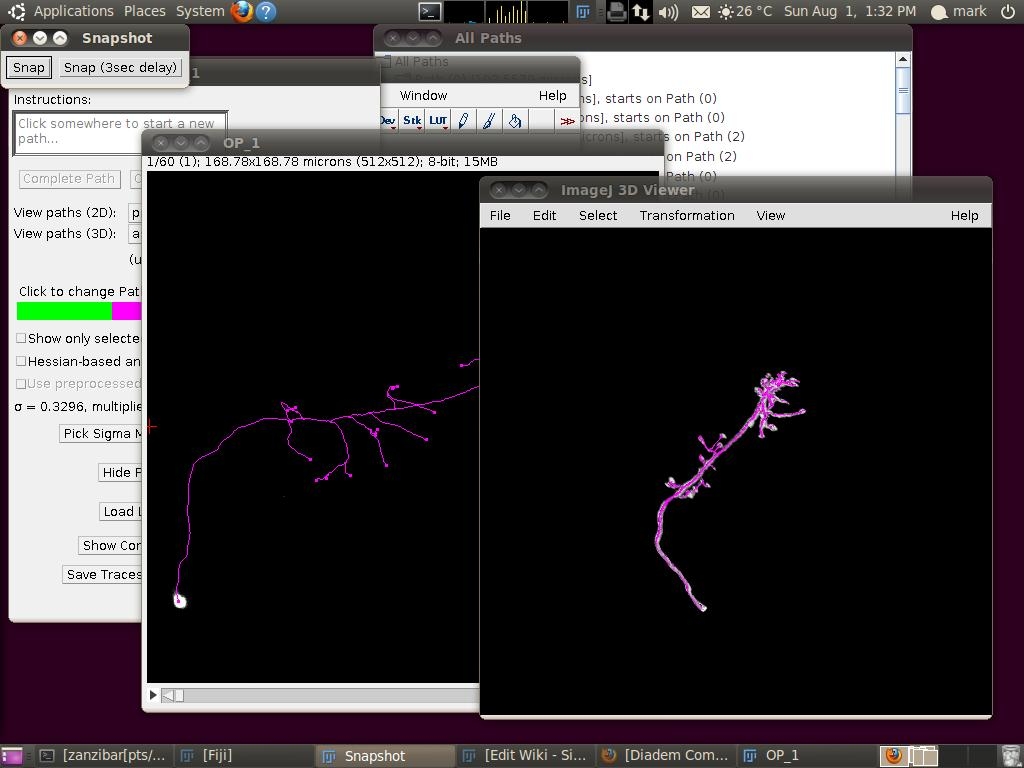
When you've loaded the traces, that should look something like this:
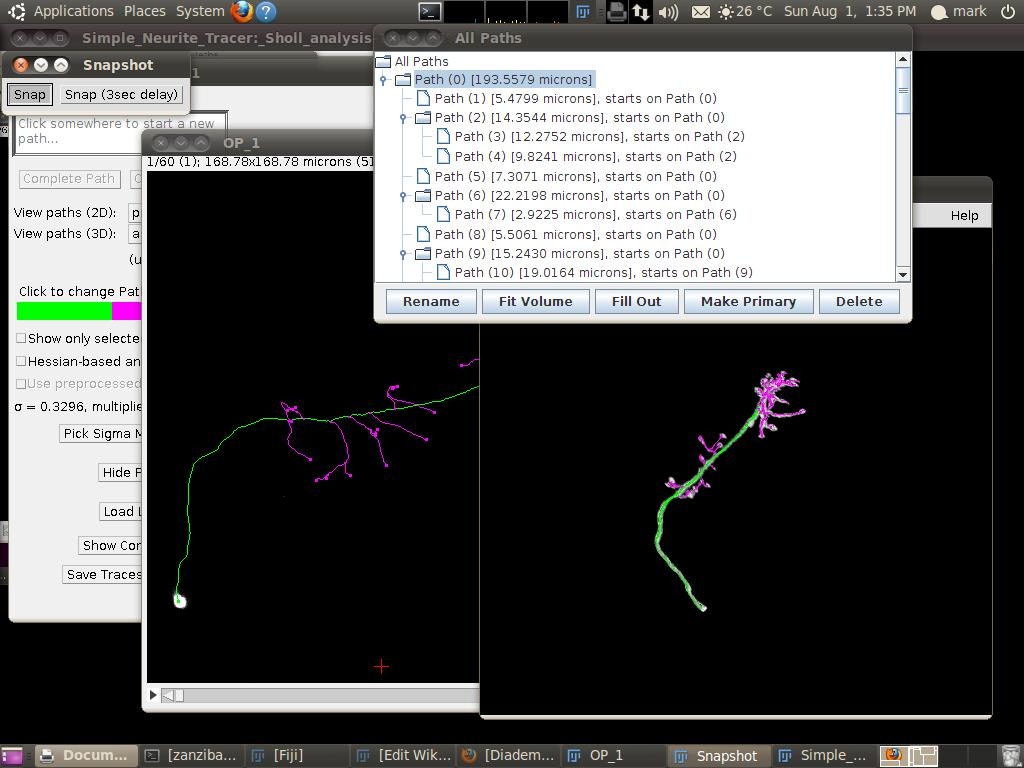
Now you have to pick a centre point for the analysis. This might be the soma or a relevant focal point. The centre point must be on one of your existing paths. First, select the path on which your centre point lies:
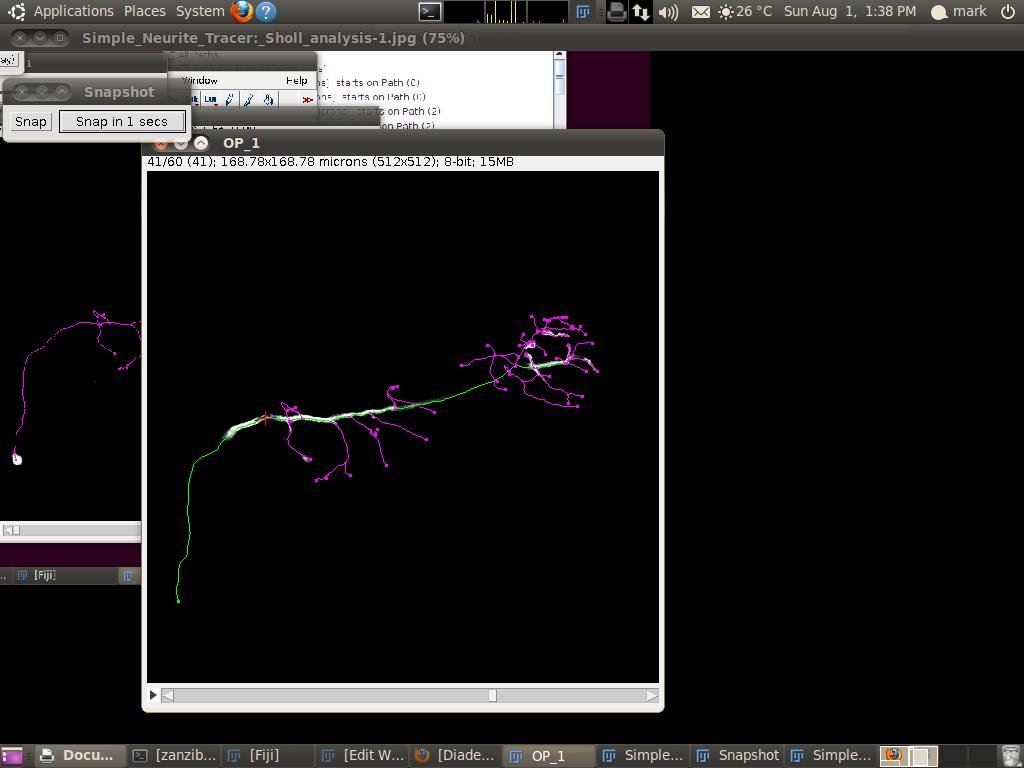
Now hold down ^ Ctrl+⇧ Shift (on Windows or Linux) or ⎇ Alt+⇧ Shift (on Mac) and move the mouse along the path. A red cross-hair should track along the path:
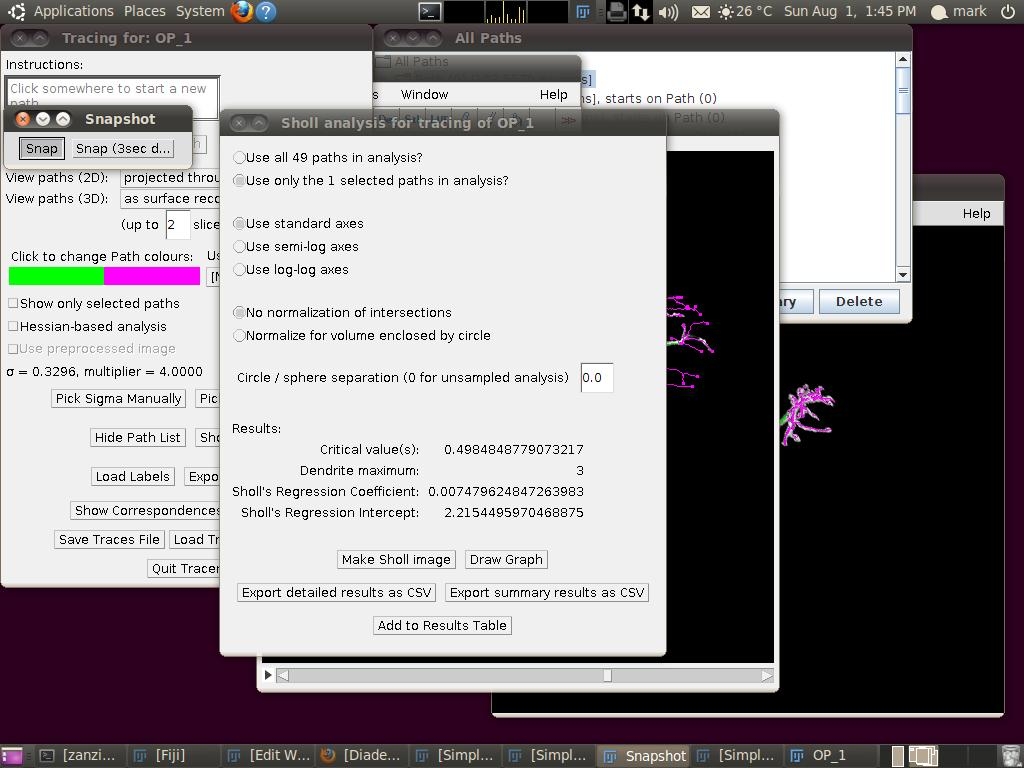
... when you've got the red cross-hairs at a suitable point, still holding down ^ Ctrl / ⎇ Alt and ⇧ Shift, press the A key. Then you can release the other keys. You should see the Sholl analysis interface appear like this:
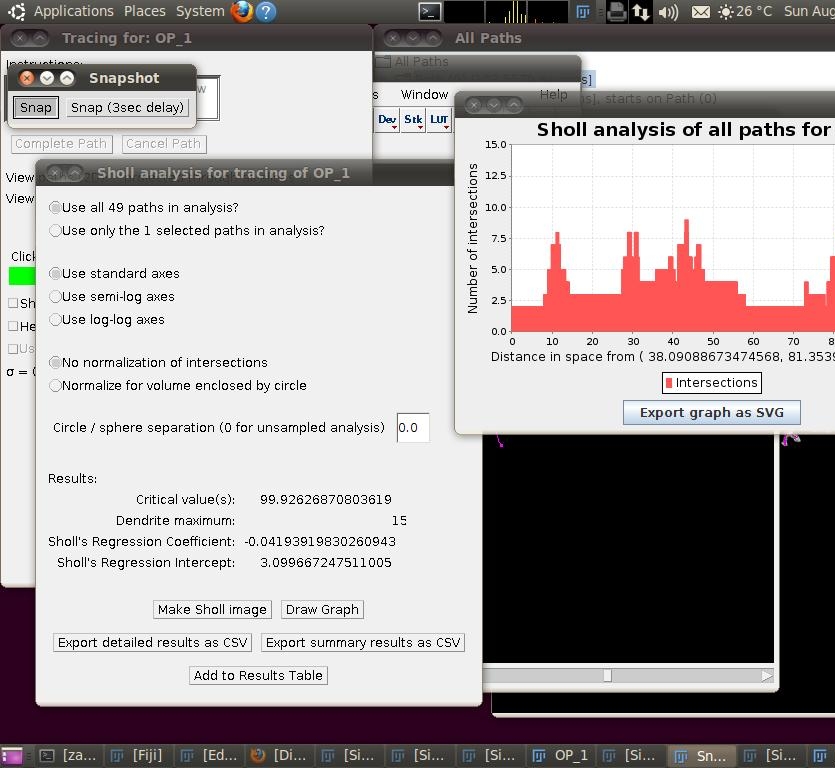
Consider the first two options: you should probably select the top option Use all N paths in analysis? unless you're only wanting to include a subset of the paths, for example if your image stack contains multiple separate neurons. Next you can click on Plot Profile so that you can visualize how the intersections with concentric spheres vary with distance from your centre point:
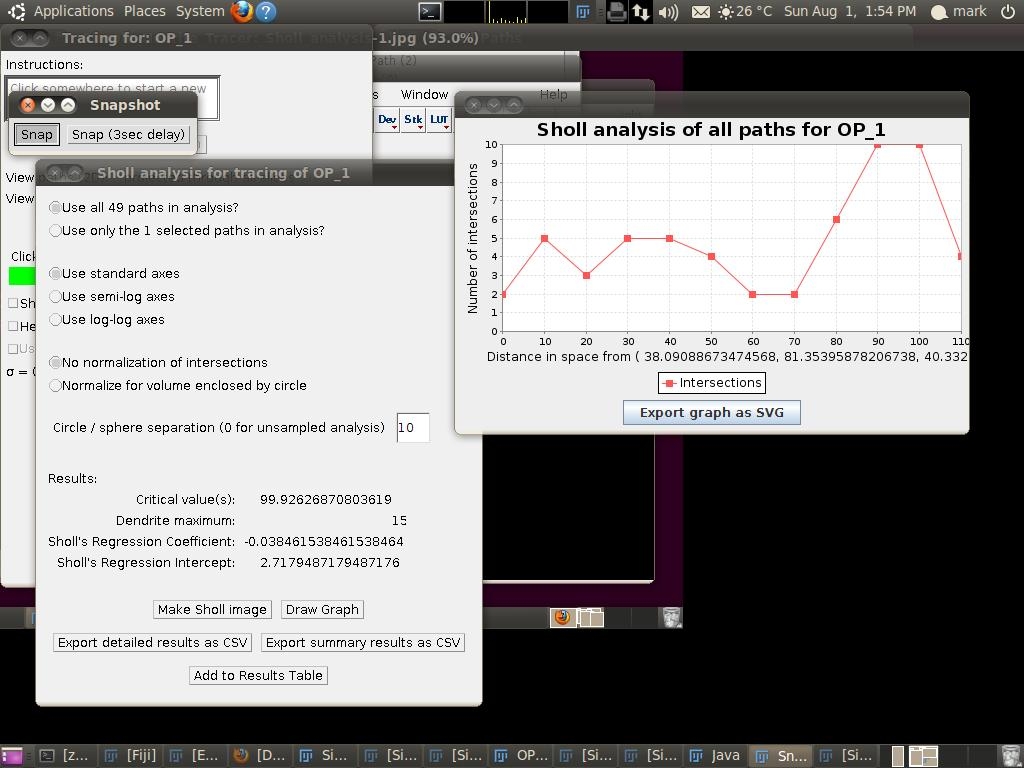
This graph shows exactly how many times a sphere of a particular radius will intersect with paths (i.e., continuos sampling). To consider spheres of evenly spaced radii (see definition of Step size), you have to enter a value into the Radius step size box. E.g.,
Data Normalization
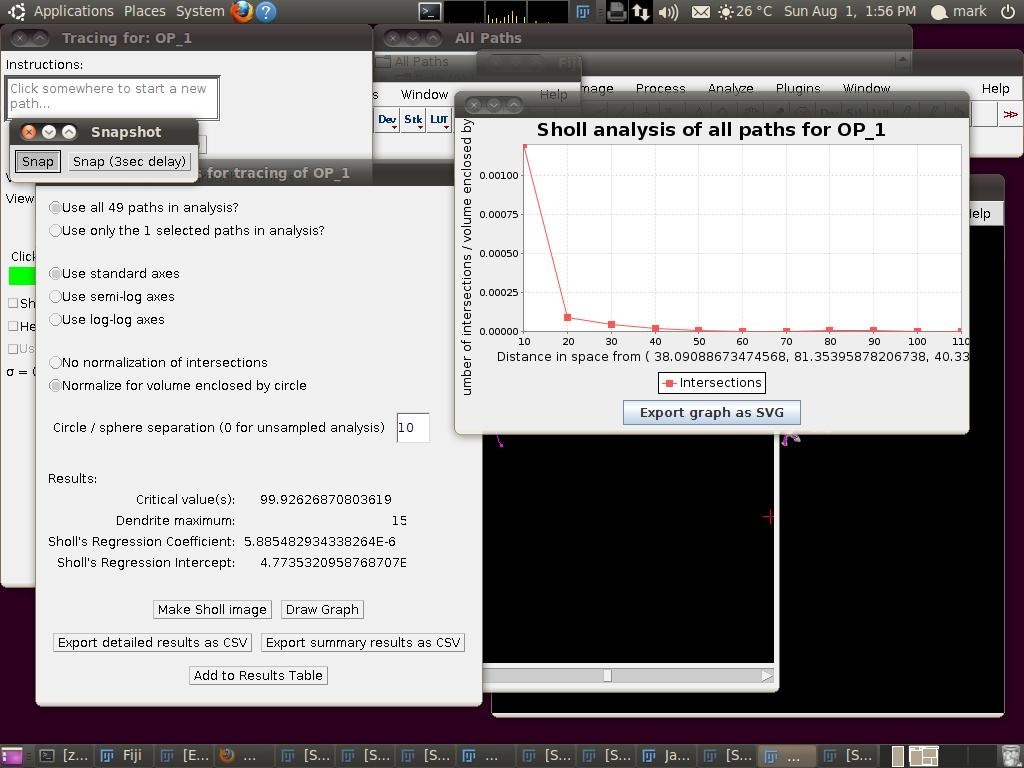
If you need to preview the effect of normalizing the number of intersections by the volume (or area) enclosed by the sphere (or circle) - you can do that by selecting the Normalize for volume enclosed by circle option:
The Use standard axes / Use semi-log axes / Use log-log axes controls whether the analysis is based on the log of normalized intersections and distance (log-log), the log of normalized intersections (semi-log) or unmodified values (linear axes) (see Sholl Plots for details. Note that the Regression coefficient is always calculated in real time even if no normalization options are chosen.
Exporting Profiles
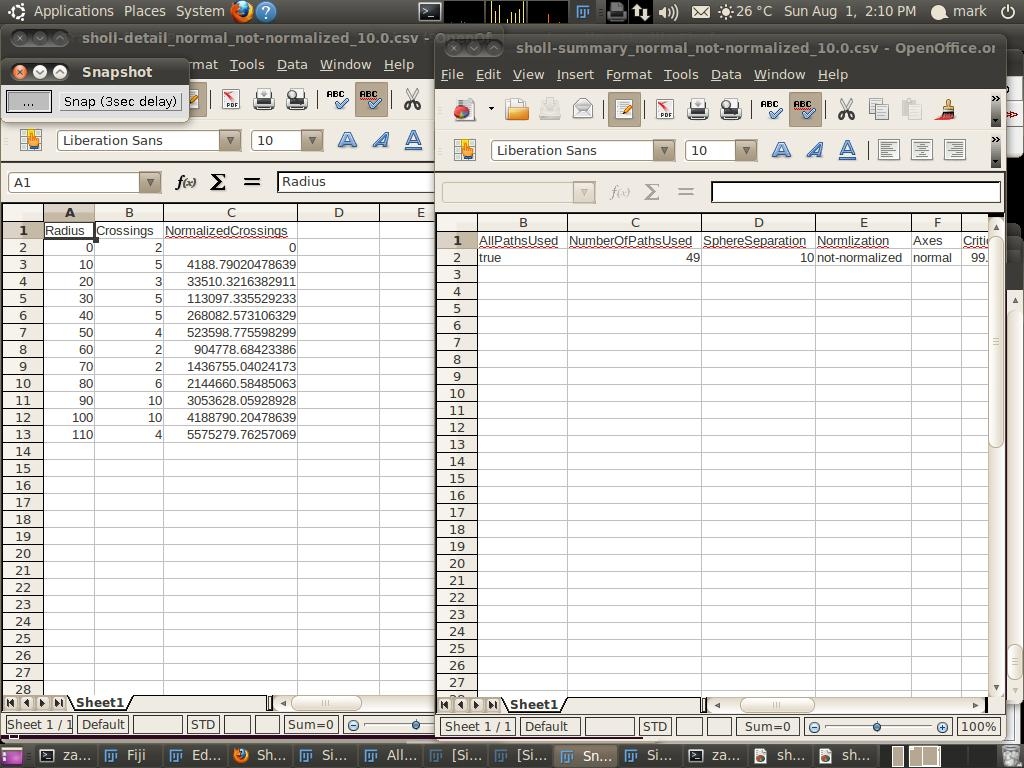
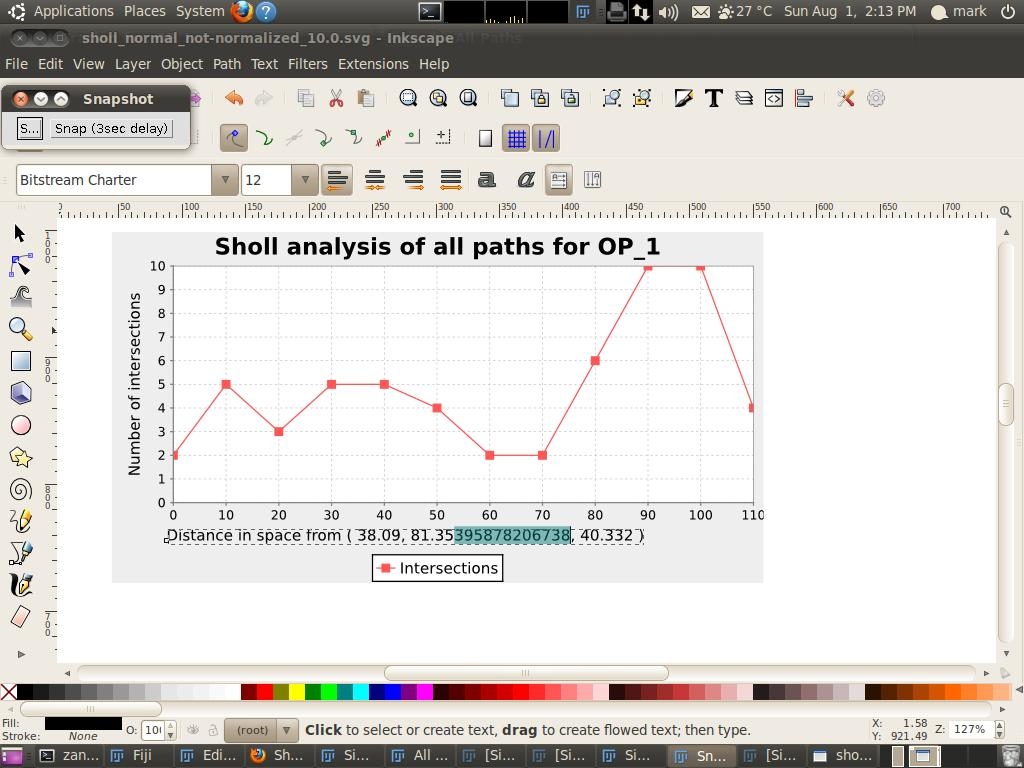
You can export profiles by clicking on "Save Profile" which will prompt for a CSV filename to save to. If you want to export the profile, so that you can edit in some other software or include it in a presentation, you can select Export graph as SVG in the graph window. You can then load the SVG file (e.g., in Inkscape):
Analyzing Profiles
Press Analyze Profile to run the Sholl Analysis plugin. Once Parameters have been specified, the plugin will automatically calculate the normalization method thought to be the most informative. Metrics will be displayed in a detailed table.
Sholl Image
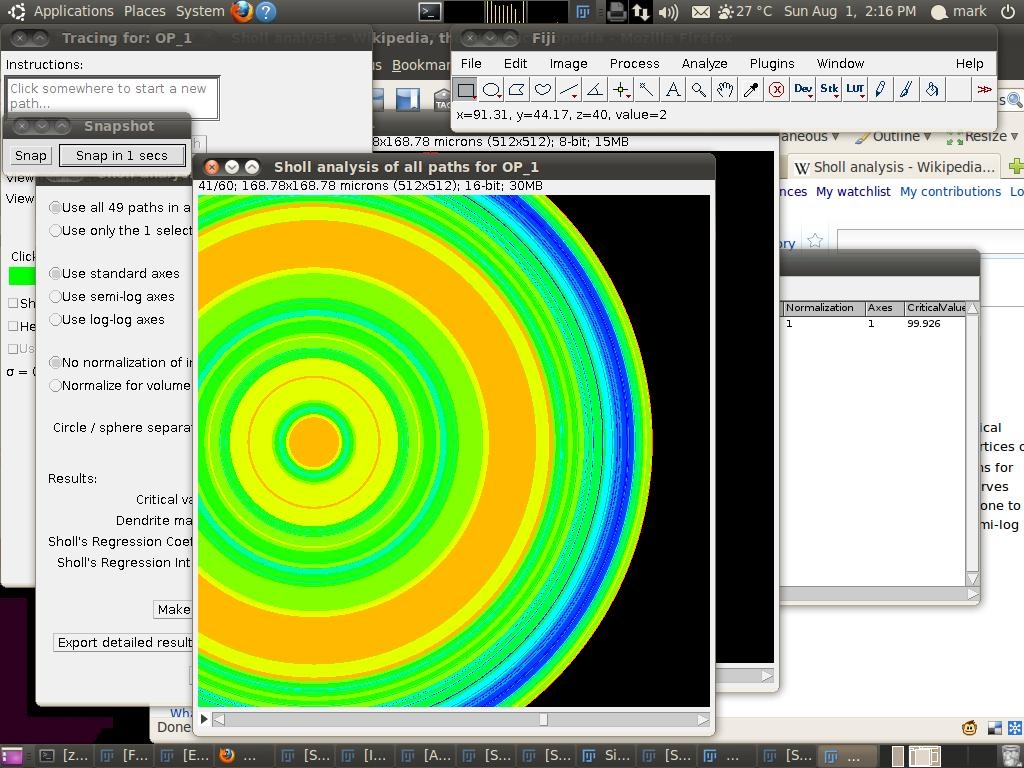
Another option that might be useful is Make Sholl image, equivalent to the Intersections mask created by the Sholl Analysis plugin when parsing images directly. This will produce a stack which shows the number of intersections at each distance from the centre point on a colour scale. You can see the exact number of intersections corresponding to a colour by mousing over that region and looking in the status bar. For example, this shows you that the orange colour corresponds to 2 intersections ("value=2"):
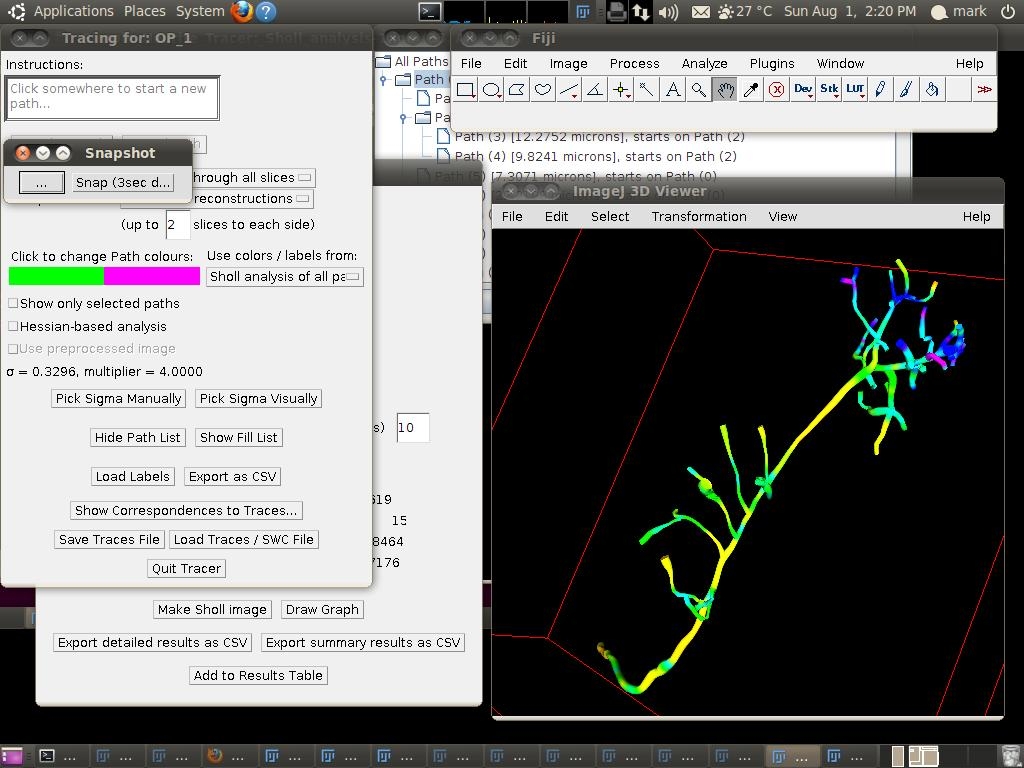
If you go back to the main tracer interface, keeping that Sholl image stack open, you can visualize those colours on the traces by switching the Use colors / labels from option to Sholl analysis of all paths (volume of original image made transparent for clarity):
