MicrotubuleTracker
| Microtubule Tracker | |
|---|---|
| Project | Fiji |
| URL | https://imagej.net/MicrotubuleTracker |
| Source | on GitHub |
| License | GPLv3 |
| Date | Wed Jul 19 12:00:45 CDT 2017 |
| Development status | Active |
| Support status | Active |
| Team | |
| Founders | SimoneR, Stephan Preibisch, Varun Kapoor |
| Leads | Varun Kapoor |
| Developers | Varun Kapoor, Stephan Preibisch |
| Debuggers | Varun Kapoor, Stephan Preibisch, SimoneR, William Hirst, Christoph Hentschel |
| Reviewers | Varun Kapoor |
| Support | Varun Kapoor |
| Maintainers | Varun Kapoor |
| Contributors | Varun Kapoor, Stephan Preibisch, SimoneR, William Hirst, Christoph Hentschel |
MTrack is a tool, which detects, tracks, and measures the behavior of fluorescently labeled microtubules imaged by TIRF (total internal reflection fluorescence) microscopy. In such an in vitro reconstitution approach, stabilized, non-dynamic microtubule seeds serve as nucleation points for dynamically growing microtubules.
MTrack is a bi-modular tool. The first module detects microtubule seeds, tracks the growing microtubule ends and creates trajectories. The second module uses these trajectories to fit models of dynamic behavior (polymerization and depolymerization velocities, catastrophe and rescue frequencies) and is able to compute population statistics such as length distributions.
To make yourself familiar with MTrack, please go to the Example section, where you are able to download an example TIRF movie and you will find detailed instruction for running it.
For using MTrack on movies which have very low signal to noise ratio you should create a denoised image to be used for segmentation and upload it along with the original movie. In this setting the microtubules pixels are identified from the segmentation movie while the actual measurement is always done on the original movie. To make yourself familiar with this setting please go to the Low SNR Example section where we detail this approach with a demo movie.
Contents
Installation
- Click Help ▶ Update....
- Click the Manage update sites button.
- Select the MTrack update site in the list.
- Click Close and then click Apply changes.
- Restart Fiji.
- Launch the plugin with Plugins ▶ MTrack.
Usage
Module 1 - Microtubule Detection & Tracking
A typical dataset consists of a single two-dimensional (2d) image of the non-dynamic microtubule seeds followed by a 2d time-lapse of the dynamically growing microtubules. The file format can be any format readable by Fiji/Bioformats (.tif, .nd2, … ). To run the tracker select Plugins › MTrack › Microtubule Detection and Tracking
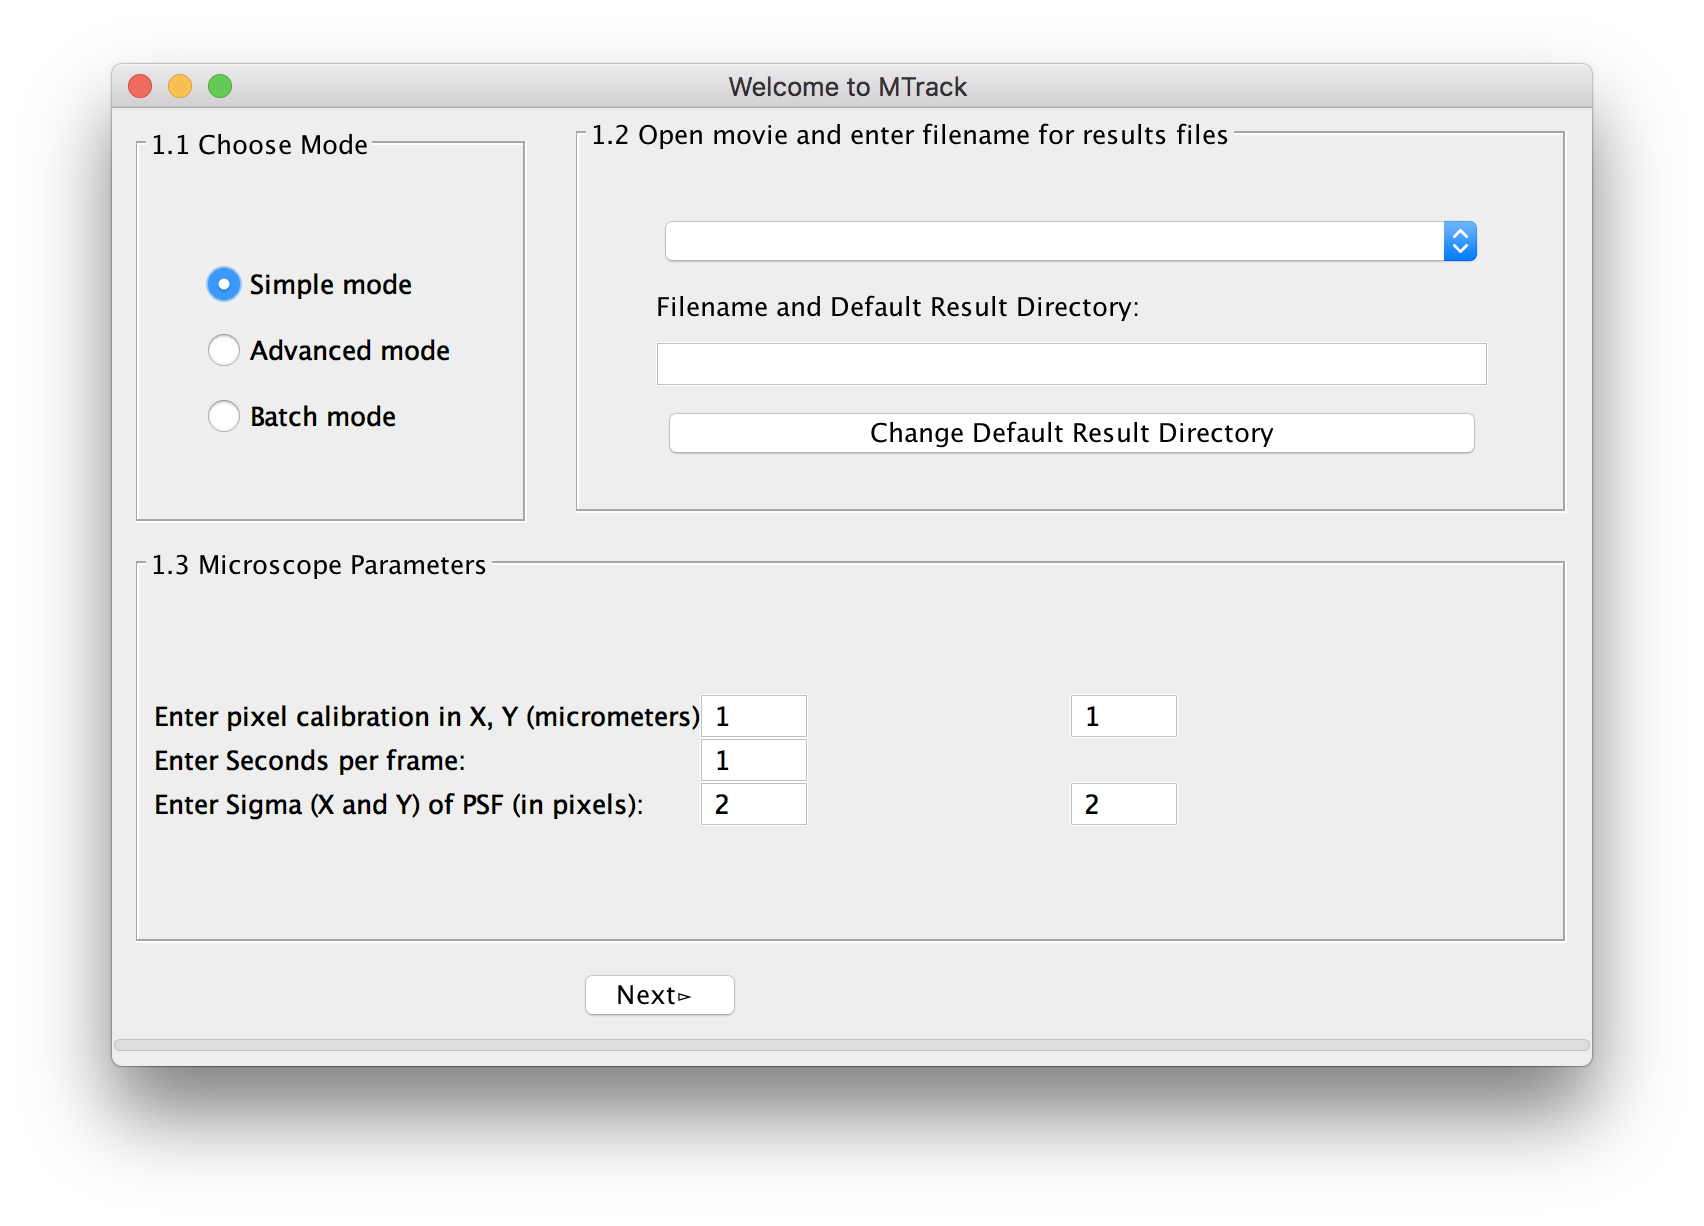
The welcome panel will open.
Choose Mode
For a first analysis of your data, we suggest using the simple mode, in which we have pre-selected a number of parameters. In case you are unsatisfied with the outcome of the tracking, you can use the advanced mode(MTrack) to fine-tune settings. When analyzing more than one movie, you can select batch mode(MTrack) and run many movies simultaneously. However, before running the program in batch mode, you have to at least run the program once in simple or advanced mode to select and save the required parameters.
The following intro is on simple mode.
Select Movie
Next, the user selects the movie. The movie to be uploaded is the original movie coming out of the microscope. In simple mode, the program will do a pseudo flat-field correction by default. This preprocessed movie will only be used for object recognition of seeds, not for end-point detection. End point detection will always be performed on the original image.
In the advanced mode, the user has the option to either perform a flat-field correction and apply a median filter of a chosen radius. Alternatively, the user can upload their own preprocessed movie. (Read more about Preprocessing(MTrack)).
For the movie type, choose one of the three supported options:
- Two channel image as hyper-stack (both channels in one image)
- Concatenated seed image followed by time-lapse images
- Single channel time-lapse images
Please choose an output file directory. The trajectory files will be written as .txt files. By default, trajectories will be saved in the current working directory with the name of the movie.
Microscope Parameters
The program automatically reads the metadata shown as pixel size (micrometer in x and y) and frame rate (in seconds). If the metadata can not be read properly, the user can manually add the values. In addition, the user is asked to enter the Sigma (X) and Sigma (Y) of the Point-Spread-Function (PSF) of the microscope in pixel units (see here for more explanation). For your convenience, our software comes with an inbuilt PSF analyzer tool, which can optionally determine the PSF of your microscope from bead images by fitting a Gaussian function.
When you input any parameters, please ensure that you use decimal number formatting only.
Press Next to proceed. Three screens and one panel will open. They show the original movie, the preprocessed movie, and the “active image”, which represents the seeds and is typically the first frame of the movie. Every successfully recognized seed will be marked with a red ellipse.
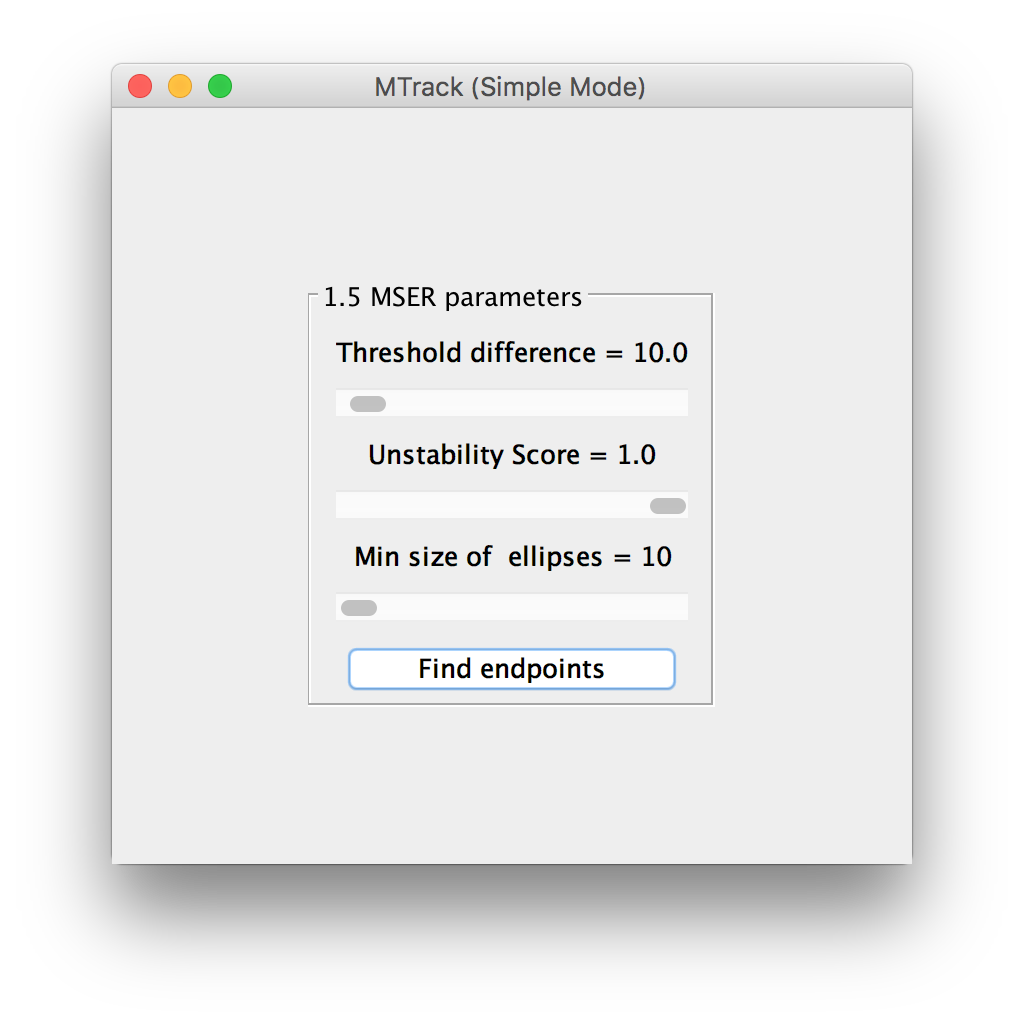
MSER parameters
The default algorithm to identify the seeds as objects is called Maximally Stable Extremal Regions (MSER)[1]. Read more about MSER parameters. If a single seed is not recognized or two very close seeds are recognized as one, the user can change the MSER parameters using the adjustable sliders. The effect will be displayed live on the “active image”. Once most seeds are correctly recognized as objects, click “Find endpoints” to detect the ends of each seed with sub-pixel accuracy.
The end-points will be displayed as green circles. A “Next” button appears on the panel, which allows the user to flip to the next panel.
Options
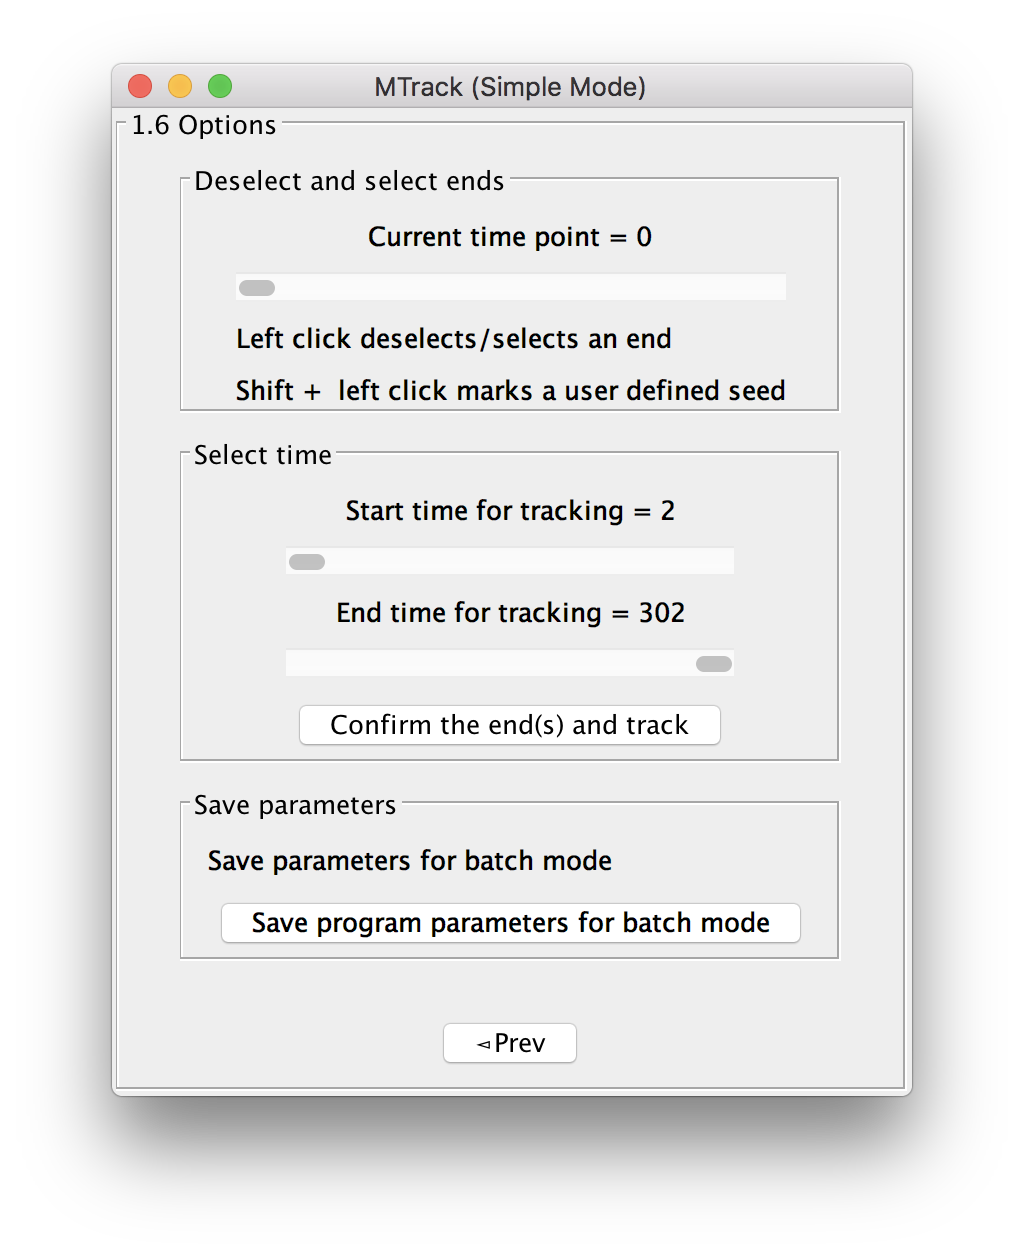
Before starting the actual tracking of the dynamically growing microtubules, the program will give you several options:
Deselect and select ends
In case an end has been wrongly recognized, the user can deselect an end by left clicking on it in the image. The program will remember and allow to re-select this end by clicking Shift + left click (pink circle will mark the end). In case an end has not been recognized, use Shift + Alt + left click to select a user defined end (orange circle will mark the end). Read more on microtubule polarity and (+) end vs. (-) end tracking.
Select time
The user can select the start and end time over which the tracking will be performed by entering the frame numbers. Click “Confirm ends and track” to perform the actual tracking, which will be performed “live” (progress bar will show).
Yellow ellipses mark seeds to be tracked, red ellipses mark seeds which won’t be tracked. Green circles mark ends to be tracked. Orange circles mark user defined ends that will be tracked. During tracking, a yellow crosshair will show the current position of the tracking on each marked microtubule. A "Success" frame will let you know about the end of the tracking. Two movies will be displayed, the “Track ID” movie, which can be used to link the trajectories to individual microtubules and an “Overlay movie”, in which the user can recapitulate the tracking. The trajectory of each end is individually saved as .txt file and numbered according to the track ID. Each trajectory will contain the following information: frame number, total microtubule length (in px and μm), track ID, x and y position (px and μm) and the length increment from the previous frame (px and µm). After successful tracking, the user has the option to save the selected ends, so that the movie can be run (again) in batch mode.
Module 2 - Microtubule dynamics
Microtubules show a dynamic behavior known as dynamic instability, which is characterized by four parameters (1) polymerization velocity (vp, nm/sec), (2) depolymerization velocity (vd, nm/sec), (3) catastrophe frequency (fcat, sec-1), and (4) rescue frequency (fres, sec-1). Module 2 derives these dynamic parameters by fitting models using RANSAC. (Read more on MTrack-RANSAC models).
If not forwarded by Module 1, Module 2 can be selected by Plugins › MTrack › Microtubule Dynamics Analyzer
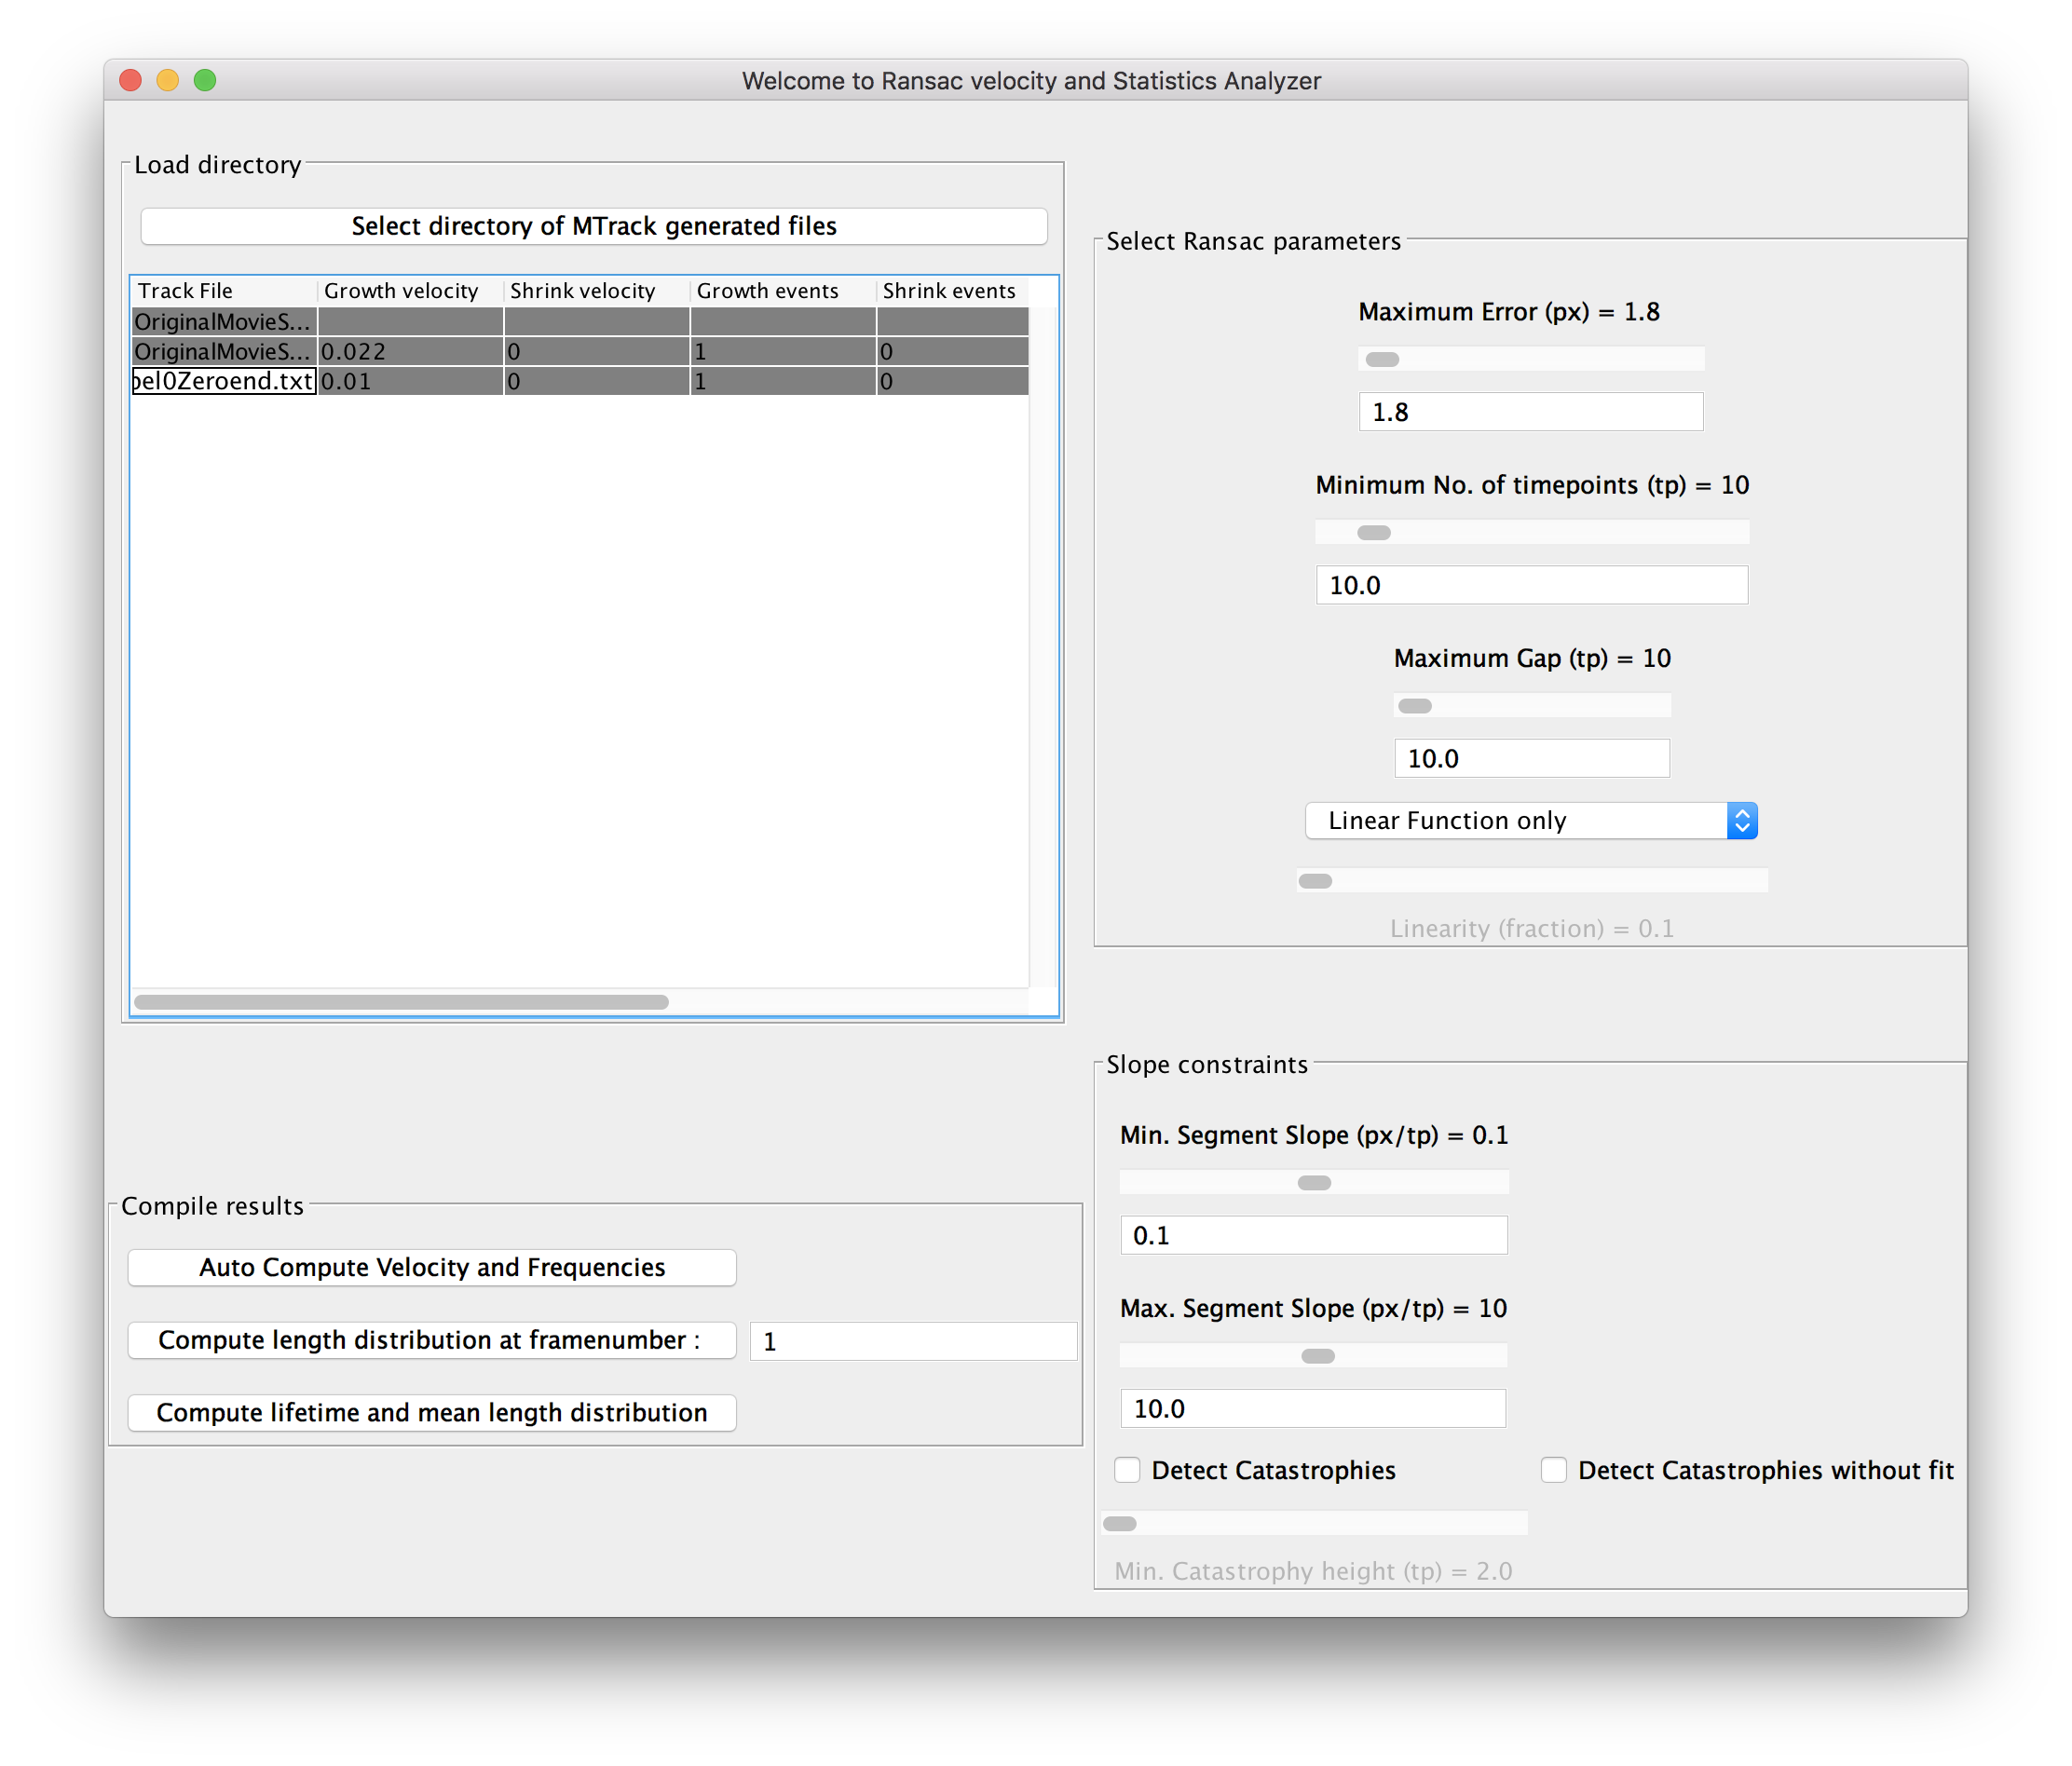
The panel that opens will allow the user to select individual files containing trajectories, which were generated in the first module. The trajectory will be displayed as length versus time plot, on which RANSAC fits a model of microtubule dynamics using the default parameters. Read more about the MTrack-RANSAC parameters.
Clicking "Auto Compute Velocity and Frequencies" auto computes the polymerization/depolymerization velocities and catastrophe and rescue frequency for all the files. If a file is empty, a warning message will show up with a blank plot.
In addition, the user can obtain microtubule length distribution for a certain time point or a time-averaged distribution. In the length distribution plot, the mean length, and the standard deviation will be displayed after fitting an exponential decay curve to the obtained distribution.
 Click here to see some examples of the MTrack-Ransac fits.
Example
An example movie with several dynamic microtubules is available for download here. To perform the analysis of this movie:
- Put the demo movie MTrack_Demo.tif into an empty directory, the results will also be stored here.
- To run the MicroTubule Tracker:
- Select Plugins ▶ MTrack ▶ Microtubule Detection and Tracking,
- Select Simple Mode, Concatenated Seed Image followed by time-lapse images, choose the file, the microscope parameters will be automatically loaded, finally click Next> to continue.
- Using the default MSER parameters 7 microtubule seeds will be identified, click Find Endpoints to continue.
- The correct endpoints of 6 microtubule seeds will be identified (one is too short and can be added manually), click Next> to continue.
- Click Confirm the end(s) and track to track the microtubules over all 241 time-points. The expected runtime is around 6-7 min. Note: the few warnings of missed assignments can be safely ignored, these timepoints will simply be missing, which does not create any further problems as long as it is not happening in the majority of cases.
- Each microtubule trajectory will be saved.
- You are now able to review the tracking results in the ImageJ windows, click Enter RANSAC stage> to continue.
- Click Select directory of MTrack generated files and select the directory that now contains all the text files with the tracking results. The assignment which file belongs to which seed the user can get via the labelled seed end points in the 'Display Tracks' window which appears after tracking the microtubules in module 1.
- To adjust the parameters to automatically derive microtubule dynamics select one of the microtubule seed end points in the panel Ransac velocity and Statistics Analyzer. The selected file will be displayed in the Microtubule Length Plot window and some parameters will be shown in an extra window. For the example file MTrack_DemoSeedLabel1Plus.txt all growth events are successfully detected. The catastrophes are shorter than the default setting, therefore the user needs to click 'Detect catastrophies without fit' to ensure a working data evaluation. Furthermore the user can adjust parameters like "Minimum number of timepoints" manually or can change the fitting function to achieve a better fit of the data.
All dynamic parameters are saved in a .txt file call 'Allaverages'. For a better presentation the user can copy and paste the data from the .txt file to Excel or an equivalent software.
Low SNR Example
An example movie with a single simulated microtubule at low SNR and the same microtubule without the noise is available for download here To perform the analysis of such microtubules:
- Put the demo movies LowSNRMTrack_Demo.tif and DenoisedMTrack_Demo.tif into an empty directory, the results will also be stored here.
- To run the MicroTubule Tracker:
- Select Plugins ▶ MTrack ▶ Microtubule Detection and Tracking,
- Select Advanced Mode, Concatenated Seed Image followed by time-lapse images, choose the LowSNR movie , the microscope parameters will be automatically loaded, finally click Next> to continue.
- In the second panel load the denoised movie and click on Load preprocessed movie and go next
- In the panel labelled Object recognition methods select MSER from the drop down menu. The microtubule would be correctly identified, click next to go to the second panel where MSER parameters are displayed. Now click Find Endpoints to continue.
- Click next to go to the next panel. Using the slider in the panel Deselect and select ends identify the non-growing end of the microtubule and deselect it from further calculations by doing a left click near it, the green circle should turn pink implying that the end has been deselected.
- Select Do MSER based segmentation from the Select segmentation method as the choice of segmentation over time. Now click Next to go to the next panel.
- To track the microtubules over all 100 time-points click on Start tracking from the Tracker options panel . The expected runtime is around 5 min.
- The microtubule trajectory will be saved.
Citation
Please note that MTrack is available through Fiji, and is based on a publication. If you use it successfully for your research please be so kind to cite our work:
Varun Kapoor, William G. Hirst, Christoph Hentschel, Stephan Preibisch and Simone Reber, “MTrack: Automated Detection and Tracking of Dynamic Microtubules” [2]
References
- ↑ Robust wide-baseline stereo from maximally stable extremal regions, J Matas, O Chum, M Urban, T Pajdla Image and vision computing 22 (10), 761-767.
- ↑ https://www.biorxiv.org/content/early/2018/07/13/368191
