LSM Worker
LSM-W2 manual
LSM-W2 extracts Leaf Surface Morphology from Laser Scanning Microscopy images
Installation: You can follow an update site with URL http://sites.imagej.net/Bionet.nsc/ (LSM-W2 in the Optional Update Sites).
Description: The plugin can work with multi-channel multi-frame 3D images in *.lsm format obtained from a laser scanning microscope. The main functionality of the plugin includes:
Assembly and visualization of images.
Improve image quality (elimination of shear and overlap, application of the anisotropic diffusion algorithm).
Linear operations with intensity values from different channels.
Detection a 2D leaf surface.
Application of the segmentation algorithm for cellular and nuclear layers.
Manual correction of segmented regions.
Marking of cell groups.
Calculation of volumes for cells and nuclei.
Comparison of cells and nuclei by mutual arrangement.
Download images in tiff format for single-channel processing (multiple images for each channel can be downloaded).
Saving results in the form of tables and intermediate images, obtained at any stage of processing.
Getting started
After starting the plugin, select a 3D image lsm-file. The plugin works only with lsm-files.
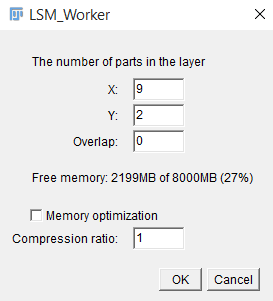
As soon as the information from the file is read, a window will be displayed showing the necessary information to form a complete multi-frame multi-channel 3D image (uploading window is showed in fig.1). To continue working with the plugin, one must specify:
The number of fragments on X axis and Y axis.
The overlap percentage. The part of the total area at the junction of the fragments is indicated as a percentage.
If necessary, you can reduce the amount of memory consumed by compressing the image (reducing the size and depth of color). Choosing this option will result in data loss and possible deterioration of the information received, but for stable operation of the plug-in, the memory consumption during the download phase should not exceed 50% of the available RAM.
After you specify all the necessary information, click “OK” and wait for the image formation.
The main window of LSM-W2
The window header displays basic information about the image, including the current slice number and the total number of slices, the size of one slice in pixels and in microns, the color depth, and the image size. In the central part of the main window, there is a layer-by-layer display of the image formed from the frames for the selected channel (the default is channel 1). At the bottom part of the main window, there are buttons and fields for working with the image.
Functions of the buttons:
The “Get original image” button cancels all changes and returns the original image.
The “Apply offset” button is responsible for shifting frames on the specified number of pixels. Reusing this option shifts frames relative to their original positions (not the current one).
The “Cut Image” button cuts the selected area for all channels from the source image. Before applying this function, you must select a rectangular fragment in the image using the standard ImageJ tool.
The “Diffusion” button allows one to apply an anisotropic diffusion filter layer by layer for all slices of the selected channel. This button calls the plugin Anisotropic diffusion 2D.
The “MorfSegmentation” button starts the plugin “Morphological Segmentation” (for more information, see section “The module of morphological segmentation by means of watersheds”).
The “Cells/Nucleus Info” button maps the segmented images of the cell walls and nuclei and displays the result in the table (for more details see section “Comparison of cells and nuclei images” section).
The “Pix Graph” button allows one to plot the intensity change depending on the layer number (“depth” of the image). After clicking the button, one must point the pixel on the image by the mouse. This information may be used to visualize the influence of the parameter of the maximum “Threshold”, which is used for construction of 2D projection for the surface layer (see details below). This option helps to select this parameter and to study the specificity of the image.
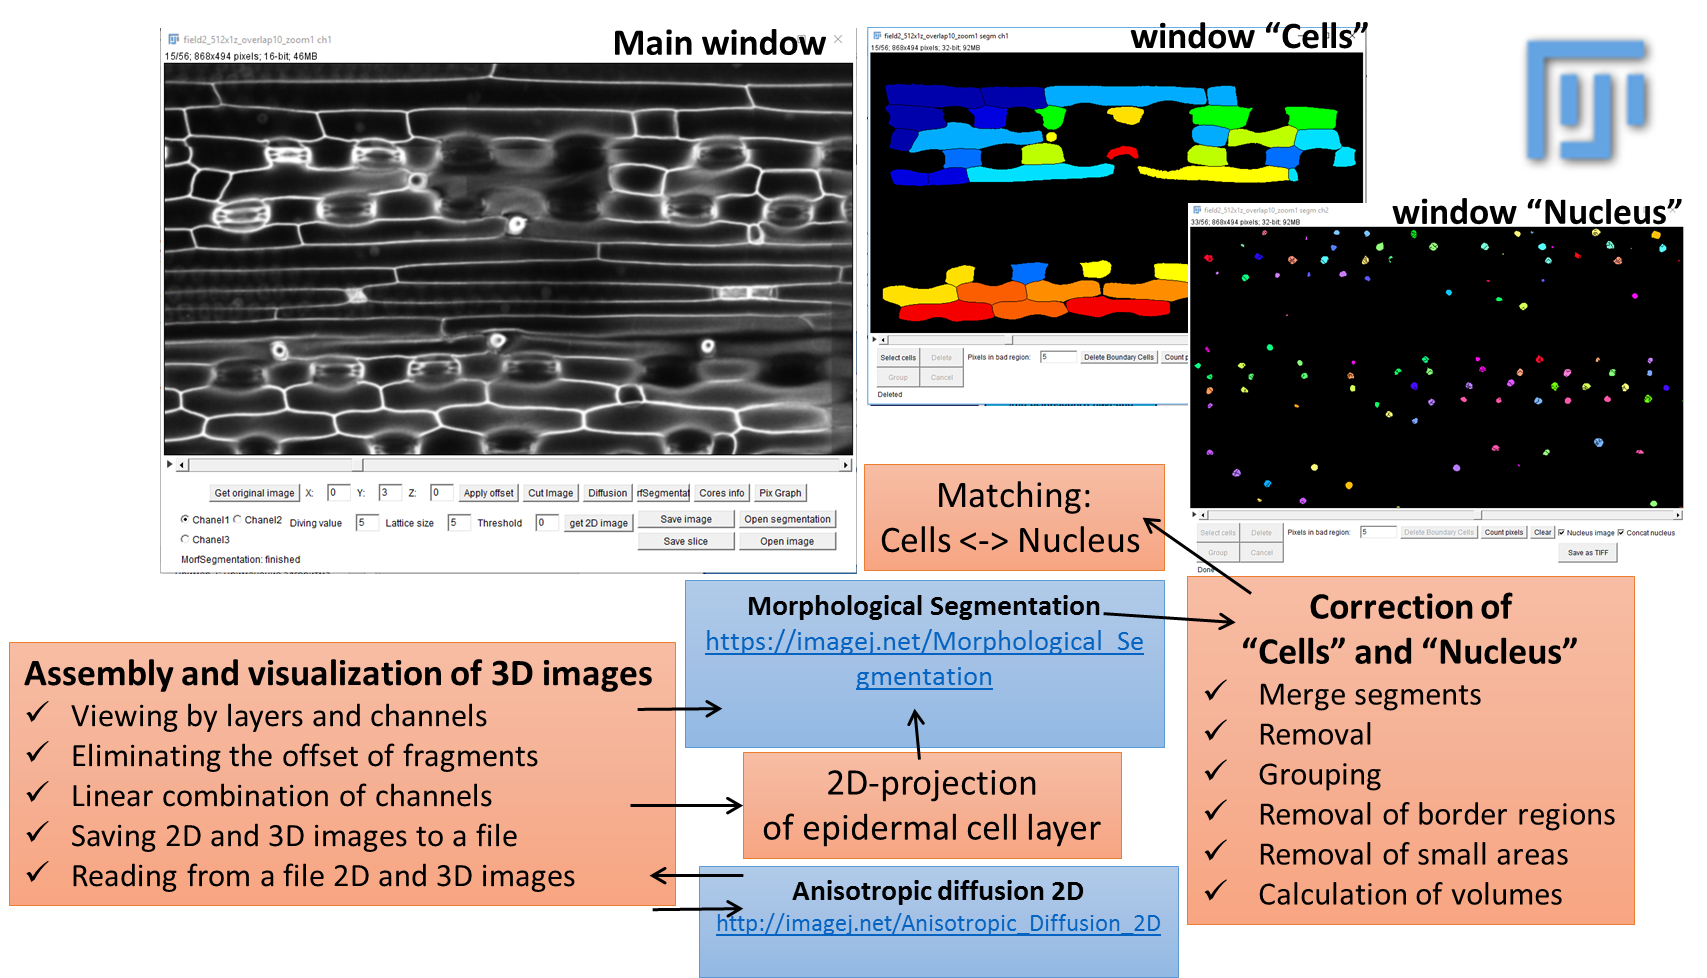
Fig.2 Main window of the LSM-W2 plugin
Description of the main window (Fig. 2)
A. Area for switching between image channels. The standard situation is the presence in the image of two channels: the channel for the image of the cells (channel 1) and the channel for the image of the cell nuclei (channel 2). The additional channel 3 is generated artificially by calculating the linear combination between pixels of the first and second channels. Many functions, such as segmentation, depend on the selected image channel.
B. Area for specifying the parameters for constructing a 2D projection of the upper cell-level walls. The “Get 2D Image” button builds this projection depending on the specified parameters:
The Diving value indicates how much pixels should be descended from the surface layer.
Lattice size specifies the number of pixels between adjacent nodes for the algorithm of construction and calculation of the surface layer.
The maximum “threshold” (Threshold) determines the optimal maximum of intensity. The maximum point is called optimal if it is a local maximum and if moving toward it to the left (the intensity increases), the intensity change at a single step (dx = 1) is greater than the set parameter “threshold”.
С. A block of buttons for loading a new image and saving the current image. Loading an image replaces the current image for the selected channel with a new one, for the first and second channel. After downloading, a number of options are disabled. Reloading an image places this image on the selected channel. Thus, it is possible to upload an image consecutively for each channel. All original meta information is stored for the new image. This approach allows one to download images that belong to the source, in different formats. The correspondence of the images is not checked and lies on the conscience of the expert interacting with the plugin. The ability to save an intermediate stage of work, and then reopen the file and continue processing, is an additional functionality.
D. The “Open segmentation” button opens segmented image.
The window for working with leaf surface
The surface of any cell layer can be selected by constructing the projection of the cellular structure onto the leaf surface from the original 3D-confocal image. In the process of constructing the leaf surface of the cell layer, it is usually considered that the maximum of intensity is concentrated on the upper layer. Figure 3 shows the surface layer of the sample in the ZoX plane. It shows that the cell walls of the upper cell layer are well colored, unlike the lower walls.
Fig.3 ZoX-projection of cell walls structure
The first step is to determine the plane of the most colored cell layer of the leaf surface.
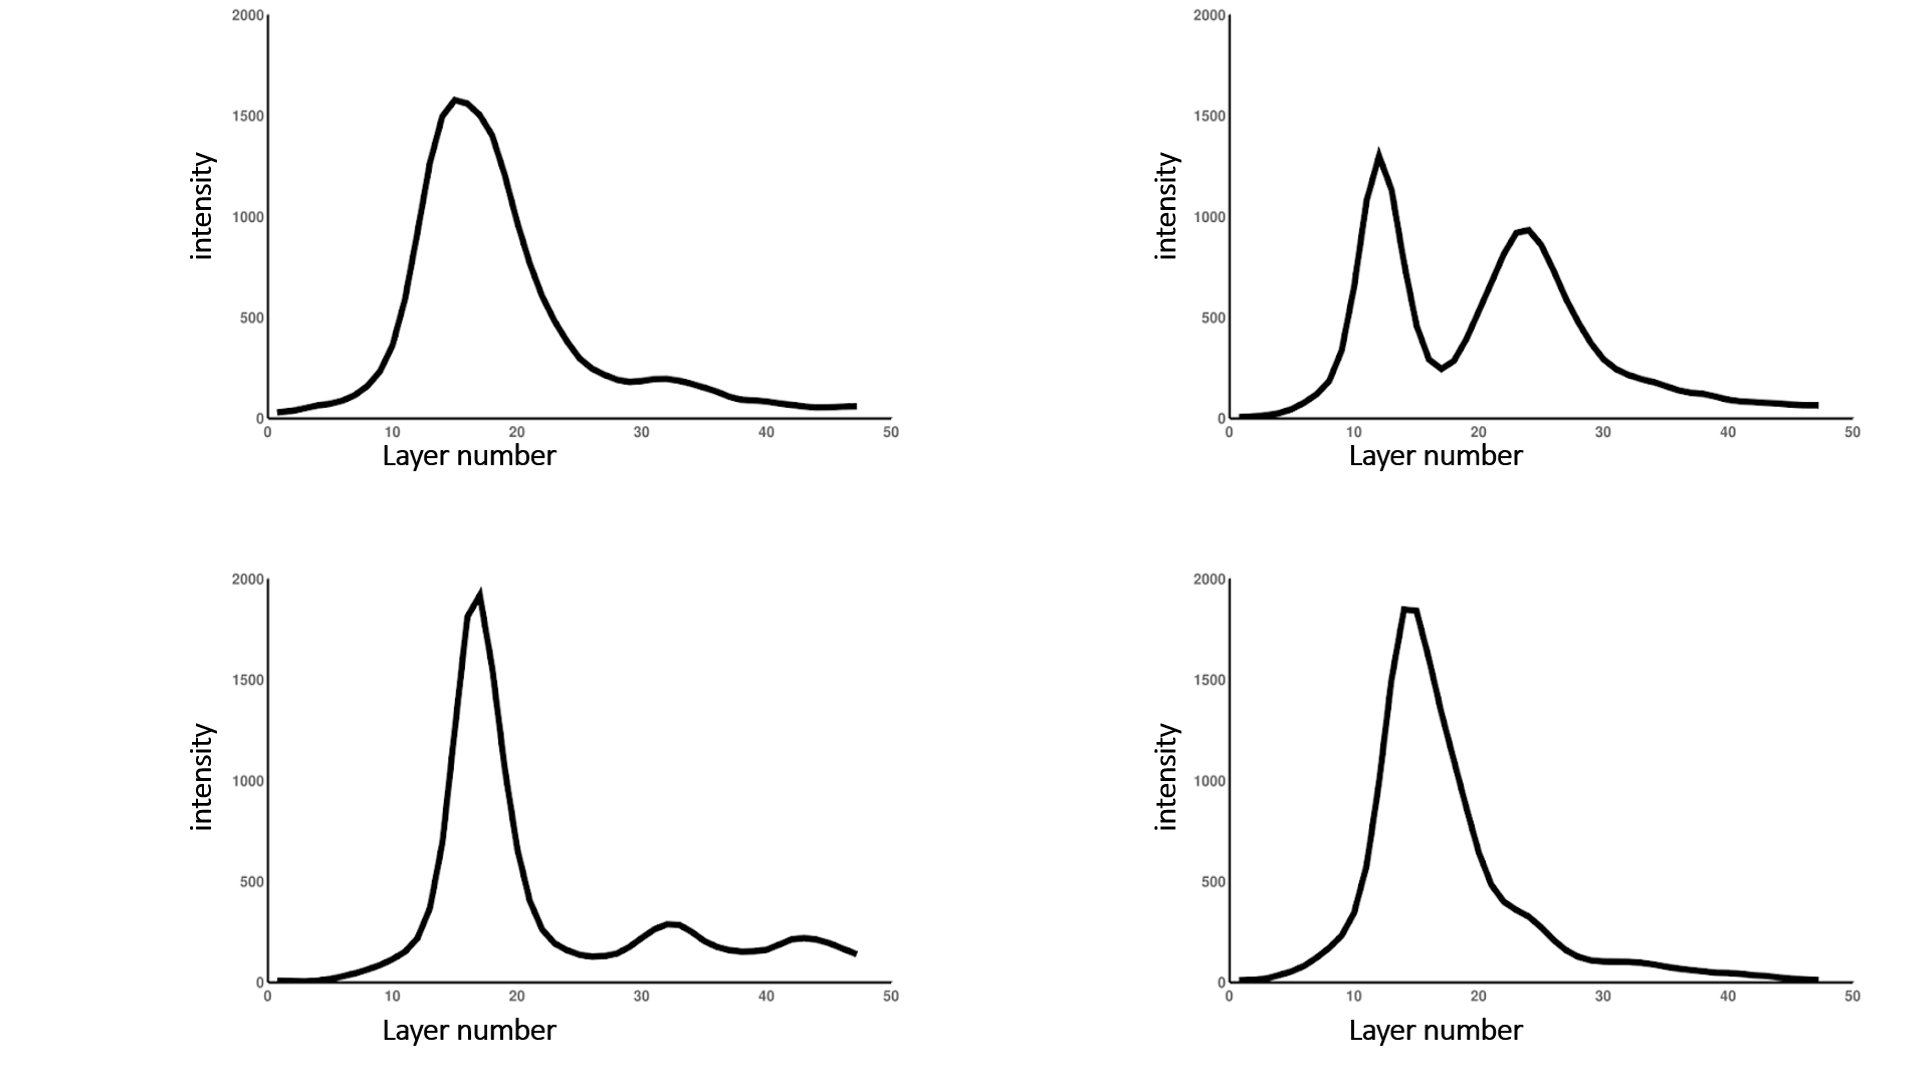
Firstly, to isolate the upper surface, it is necessary to determine the range of layers on which the plane of intensely stained cell walls is located. The “Pix Graph” button is used to plot the intensity change depending on the layer number. With this option, it is possible to study the dependence of the intensity on the number of the slice in 3D images (see fig. 3).
Fig. 4 Samples of plots for intensity distribution over the 3D image slices
Points of local maxima corresponding to the pixels with the greatest intensity build the upper surface of the leaf.
The following parameters are used to build a leaf surface.
Threshold is the parameter responsible for specifying the local maximum of the intensity. The point of the upper surface of the leaf is the optimal local maximum, in the right half-neighborhood of which the rate of falling of the graph of the signal intensity exceeds the value of the specified parameter.
Diving value is the parameter responsible for the distance between the plane of the leaf surface and the plane of the cut. This parameter is selected individually depending on the intensity of staining of the sample and the height of the cells of the upper layer, as well as the underlying layers.
Lattice size is a parameter that determines the density of the grid, allows one to optimize the process of constructing the leaf curve surface with minimal construction errors. The increase in the parameter value is directly proportional to the absolute distance between the axes and leads to a decrease in their number, speeding up the process of constructing the leaf surface. Zero value of this parameter is equivalent to building an axis in each pixel. After constructing a discrete surface of the leaf, an automatic approximation of the values is performed to smooth the resulting surface.
To work with the selected surface cell layer, an additional window was developed (fig. 5). This window visualize the result in the form of a 2D plane image and a corresponding “surface mask”. The “surface mask” is a 2D image, where the value of each pixel is equal to the number of slice from the original image. Applying a “surface mask” to the original 3D image allows one to obtain a 2D image of the upper cell layer structure.
To switch between the “surface mask” tab and the “2D cell structure” tab, one should change the flag “Image Mask”.
Fig. 5 Screenshot of the window for working with superficial cell layer
Changes in pixels values of the “surface mask” entail changes in the process of the leaf surface constructing. Smoothing of the “surface mask” leads to an improvement of the quality for the resulting image of cell structure. As a rule the standard processing functions integrated into ImageJ (the median filter, gray morphology function) are useful.
After the improvement 2D segmentation could be evaluated by pressing the “MorfSegmentation” button.
The segmentation module by the marked watershed segmentation algorithm
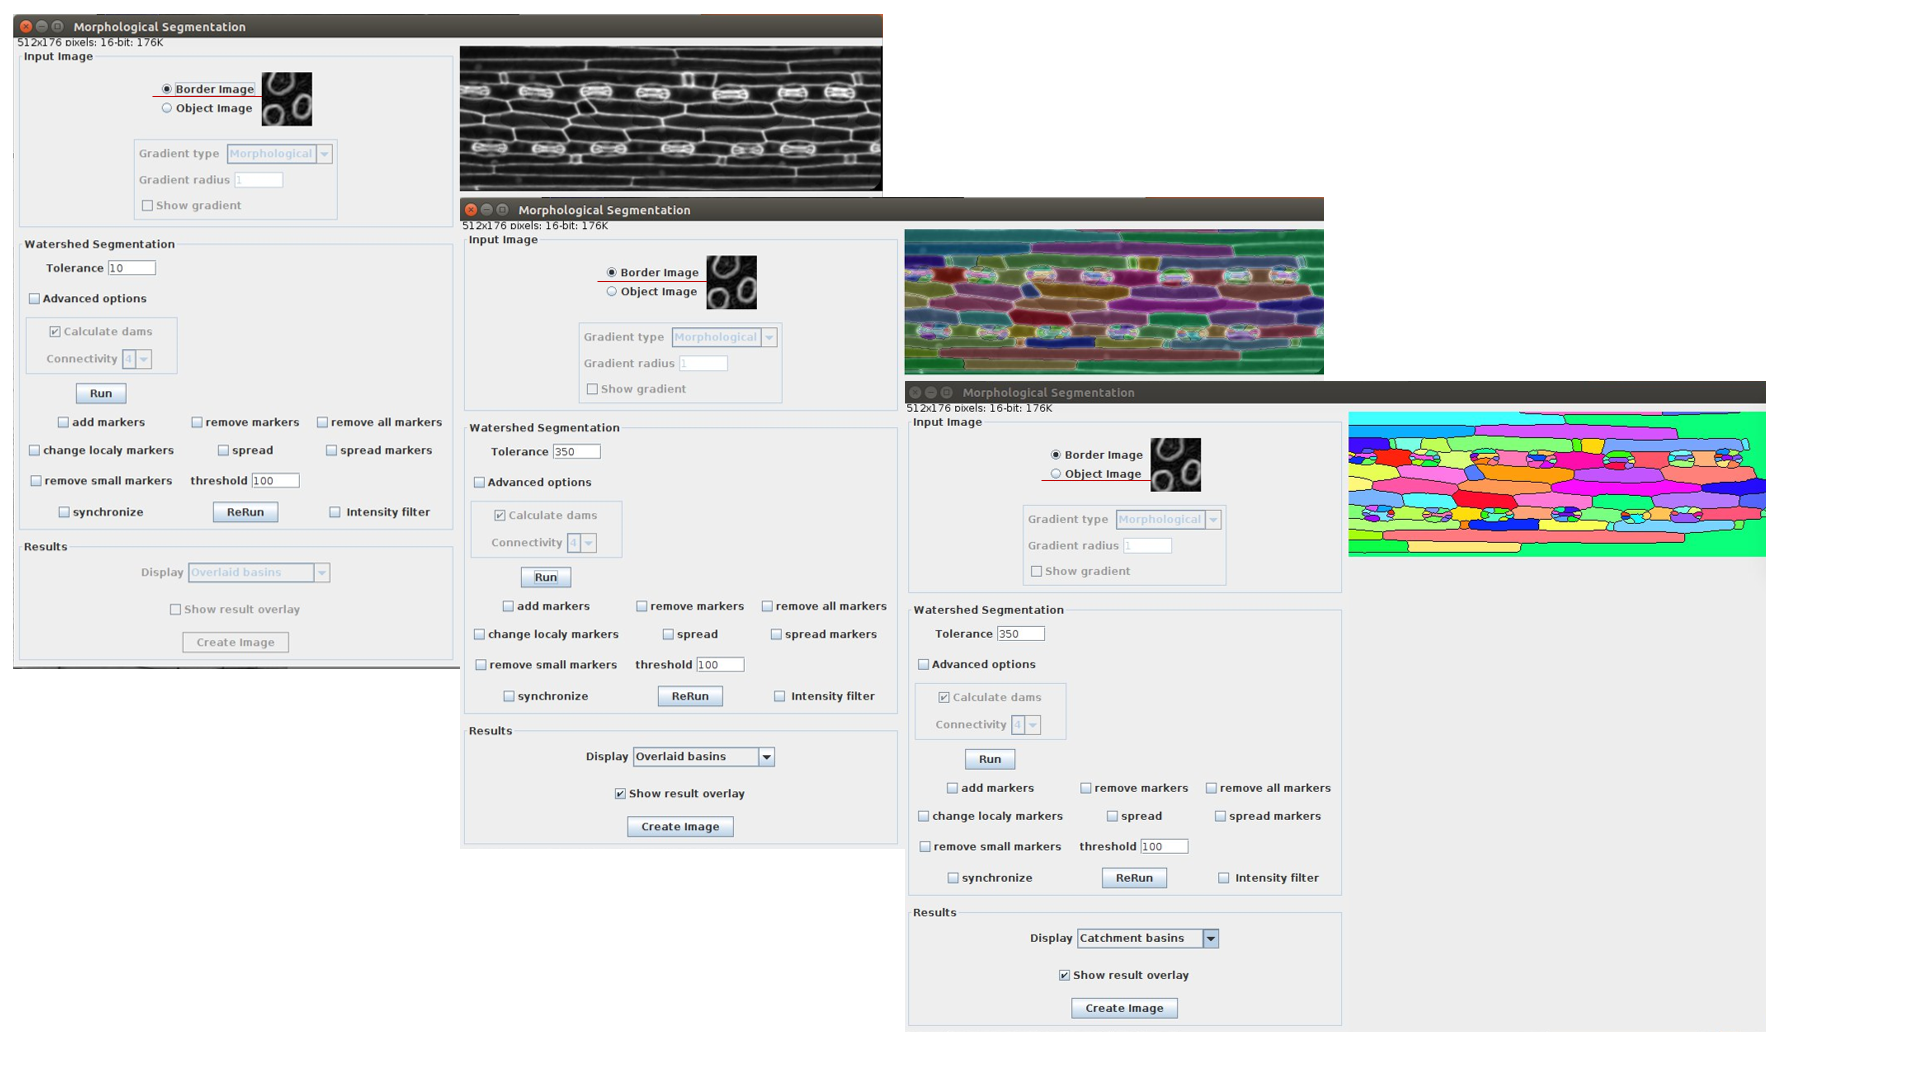
Morphological Segmentation integrated into LSM-W2 implements the segmentation of the image. The plugin Morphological Segmentation combines morphological operations, such as extended minima and morphological gradient, with watershed flooding algorithms to segment grayscale images. The main plugin’s window is shown in Figure 6.
This plugin can process images with cell walls (Border Image) and images with cell nuclei (Object Image). During the work with the plugin Morphological_Segmentation one should specify the parameter Tolerance, which indicates the intensity of local minimum. This parameter requires an individual manual calibration depending on the image.
Fig. 6 Screenshot of the window for the plugin Morphological_Segmentation
After pressing the button “Run” one should waiting for the segmentation processing. If it is necessary, you also could change the Tolerance value and repeat segmentation. Then import the result image carrying out the following steps:
Choose result image display type as “Catchment basins” (Results -> Display).
Create the window with segmented image (press “Create Image”)
Close the main window of Morphological_Segmentation plugin and return back to the window of LSM-W2 plugin.
The button “MorfSegmentation” will change to the button “Get result”. The button “Get result” opens the window with segmented image.
The window for working with segmented image
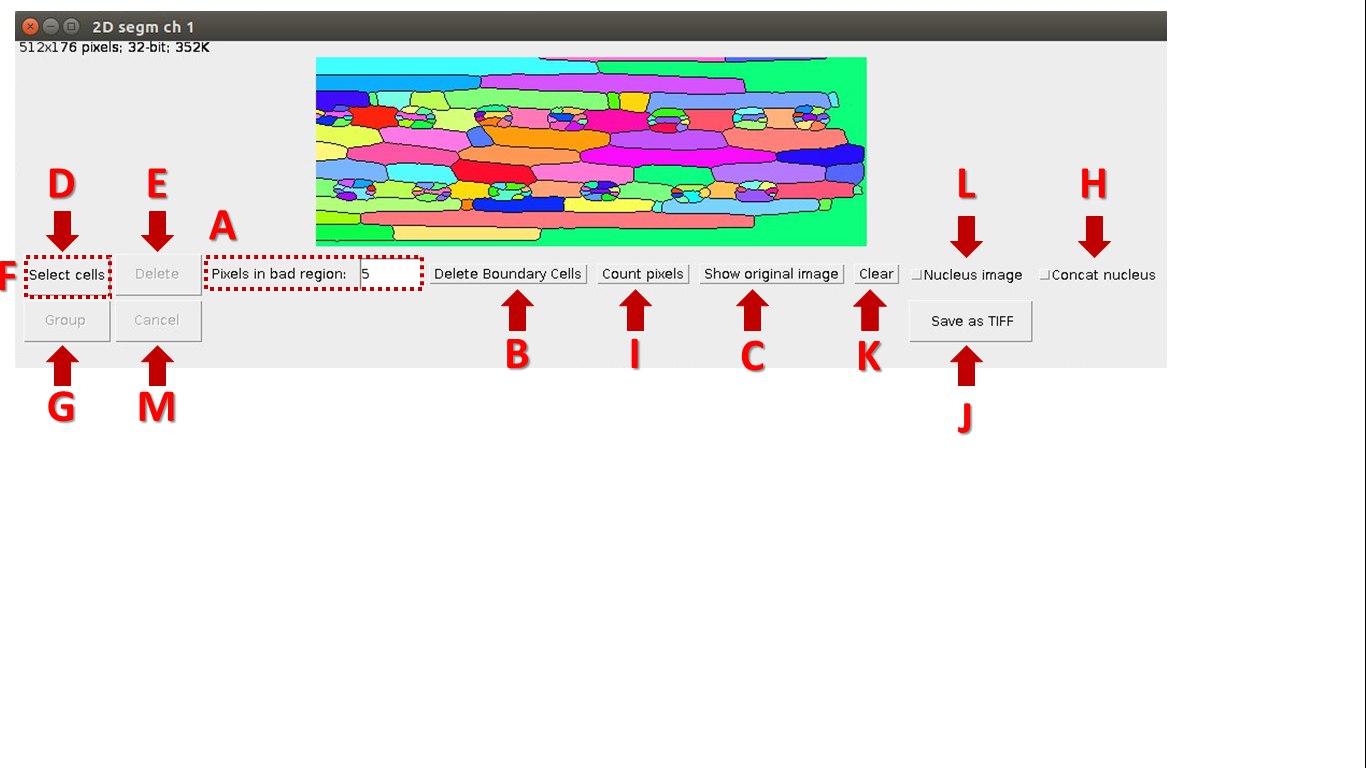
A colorized 3D/2D image is a result of segmentation through the plugin Morphological_Segmentation, integrated with LSM-W2. An additional window is used to edit segmented regions.
Fig. 7 Screenshot of the window for working with segmented image
Description of the window for working with segmented image:
A. Fix the minimal amount of pixels for a segmented area. After choosing the parameter “Pixels in bad region” all elements with less amount of pixels will be removed from further consideration.
B. The “Delete Boundary Cells” button will delete objects on the border of image.
C. The “Show original image” button will return the original image.
D. The “Select cells” button allows choosing segmented areas. Indices of selected areas are displayed at the bottom of the window.
E. Delete selected segmented areas.
F. The “Combine” button unite segmented areas after selection (button “Select cells” will change to button “Combine”).
G. The “Group” button group segmented areas after selection. Group indexes will be indicated in the results table
H. “Contact nucleus” corrects over segmented nuclei by association of bordering objects of nuclei segmentation.
I. The “Count pixels” button displays the resulted measurements in csv-file. Navigation between tables and segmented areas is realized by selection an element in the table. The color of corresponding segmented area will changes. The index of the area in the resulting table is displayed at the bottom of the window when you click on it.
J. The “Save” button saves results image in tif-file.
K. The “Cancel” button cancels changes and returns to the original image.
L. The flag “Nucleus image” indicates the image with nuclei.
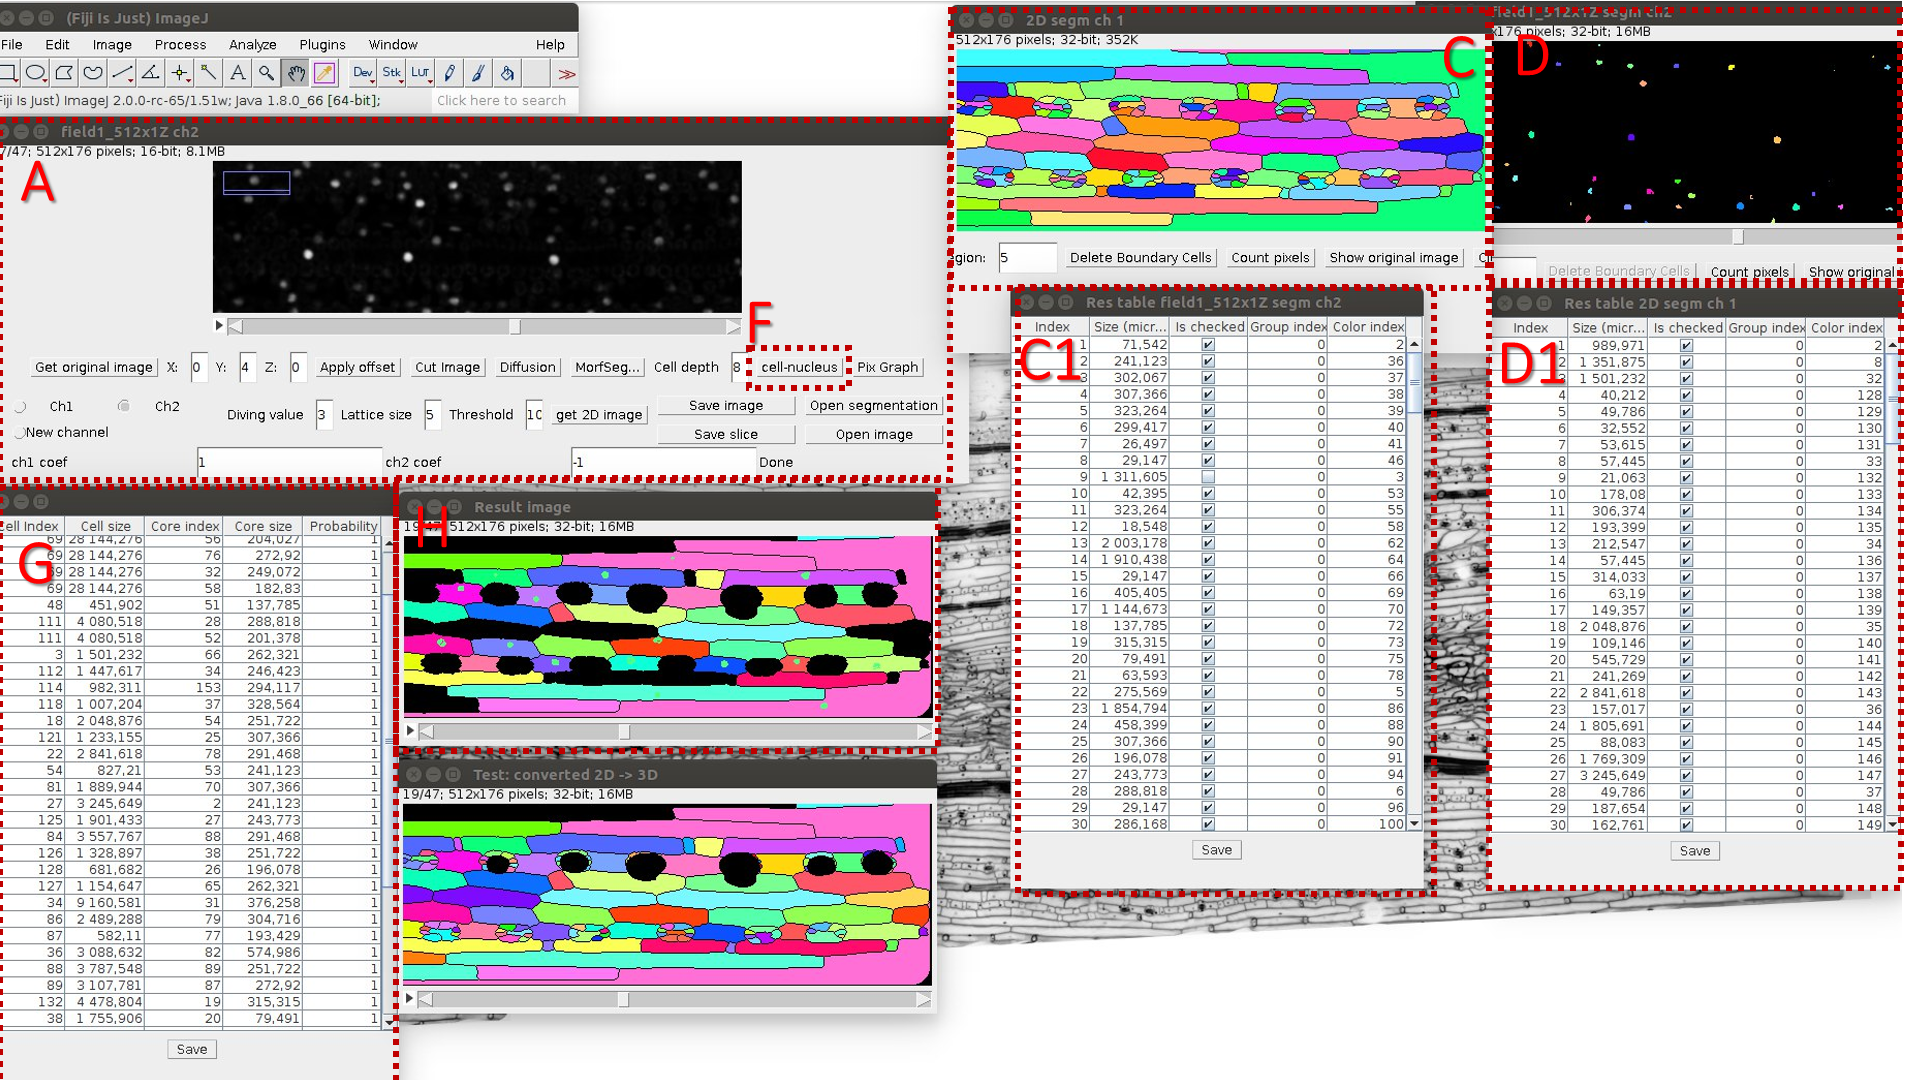
Comparison of cells and nuclei images
The algorithm:
A. Run LSM-W2 and open original 3D image.
B. Select a set of points distant from the leaf surface by a distance d.
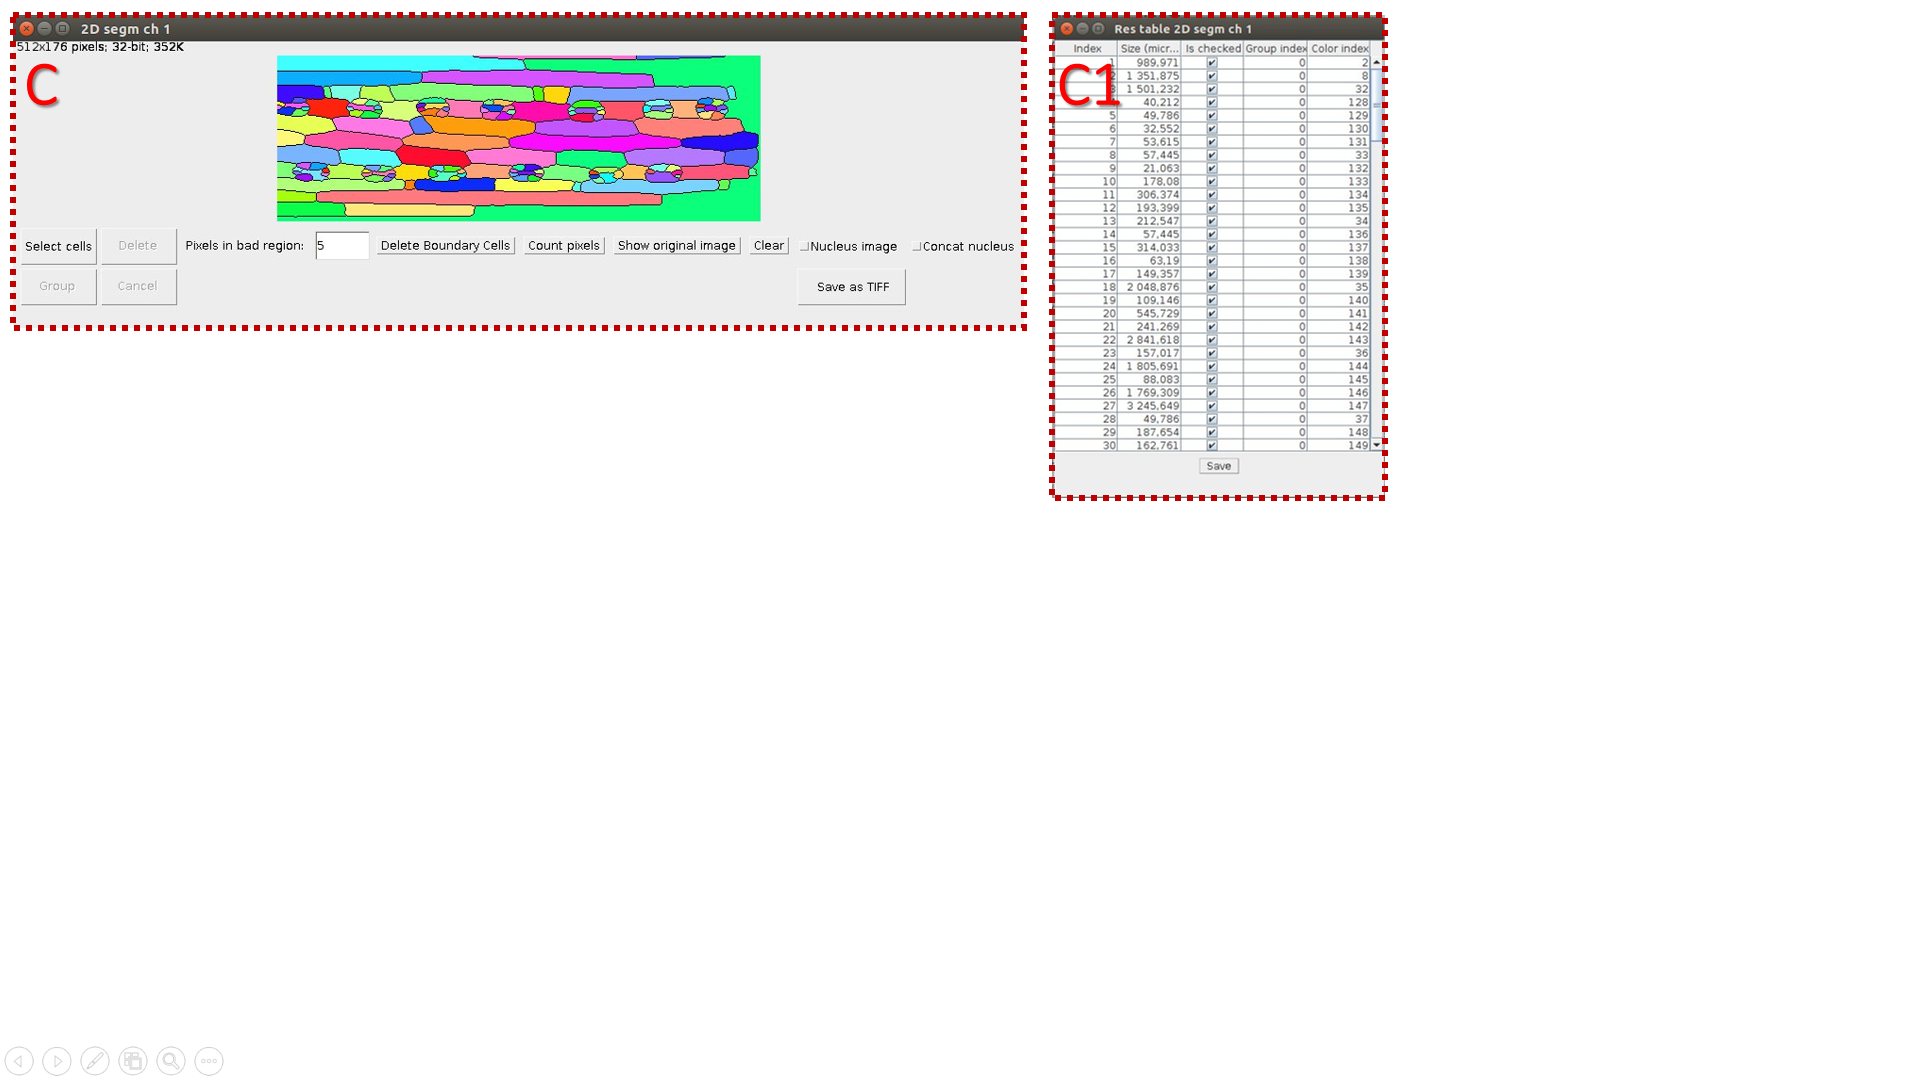
C. Make a segmentation of resulting 2D image (Border Image) and count objects’ volumes. C1 is a resulting table.
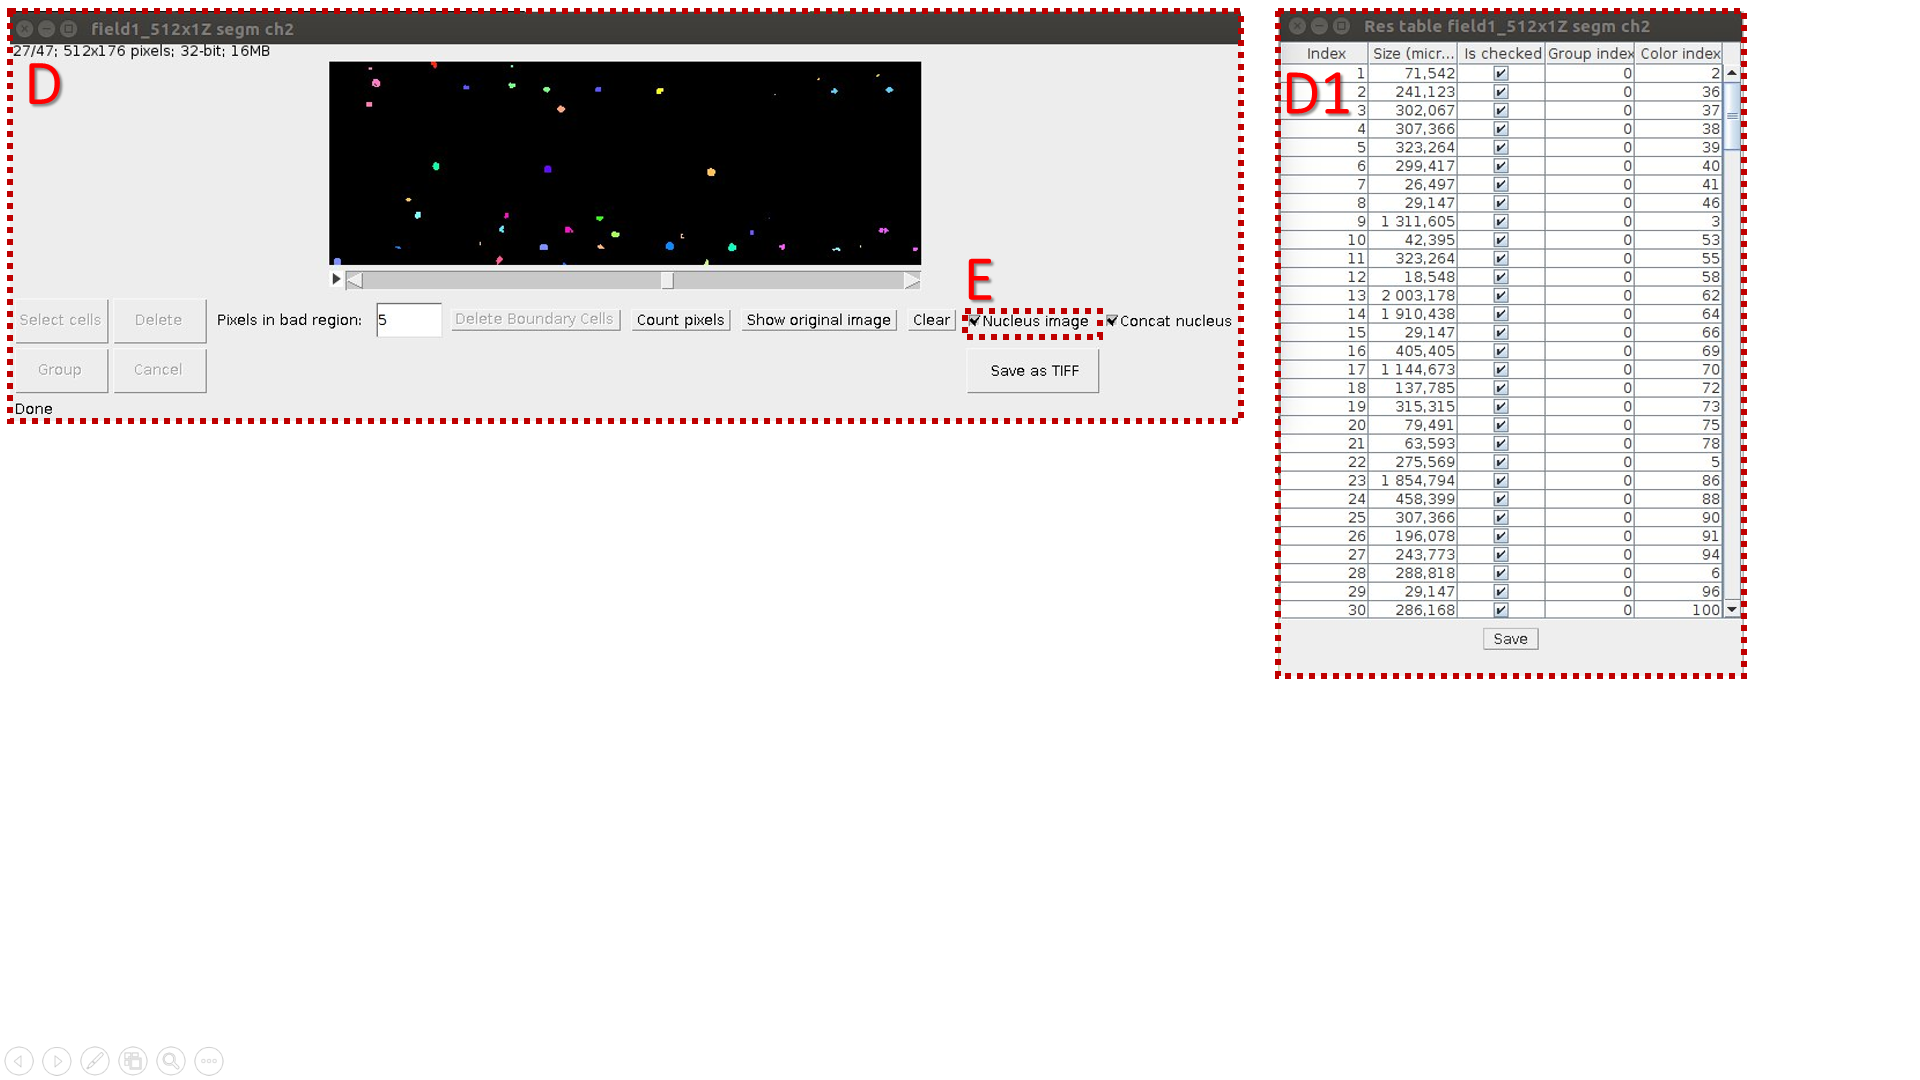
D. Make a “nuclei segmentation” of original 3D image (Object Image) and count volumes of segmented areas (C1 is a resulting table}.
I. Mark the image with nuclei by the “Nucleus image” flag in the checkbox.
E. Calculate the correspondence between cells and nuclei by pressing the button “Cell-nucleus”. It is necessary to keep all resulting tables and segmentation windows opened for correct work.
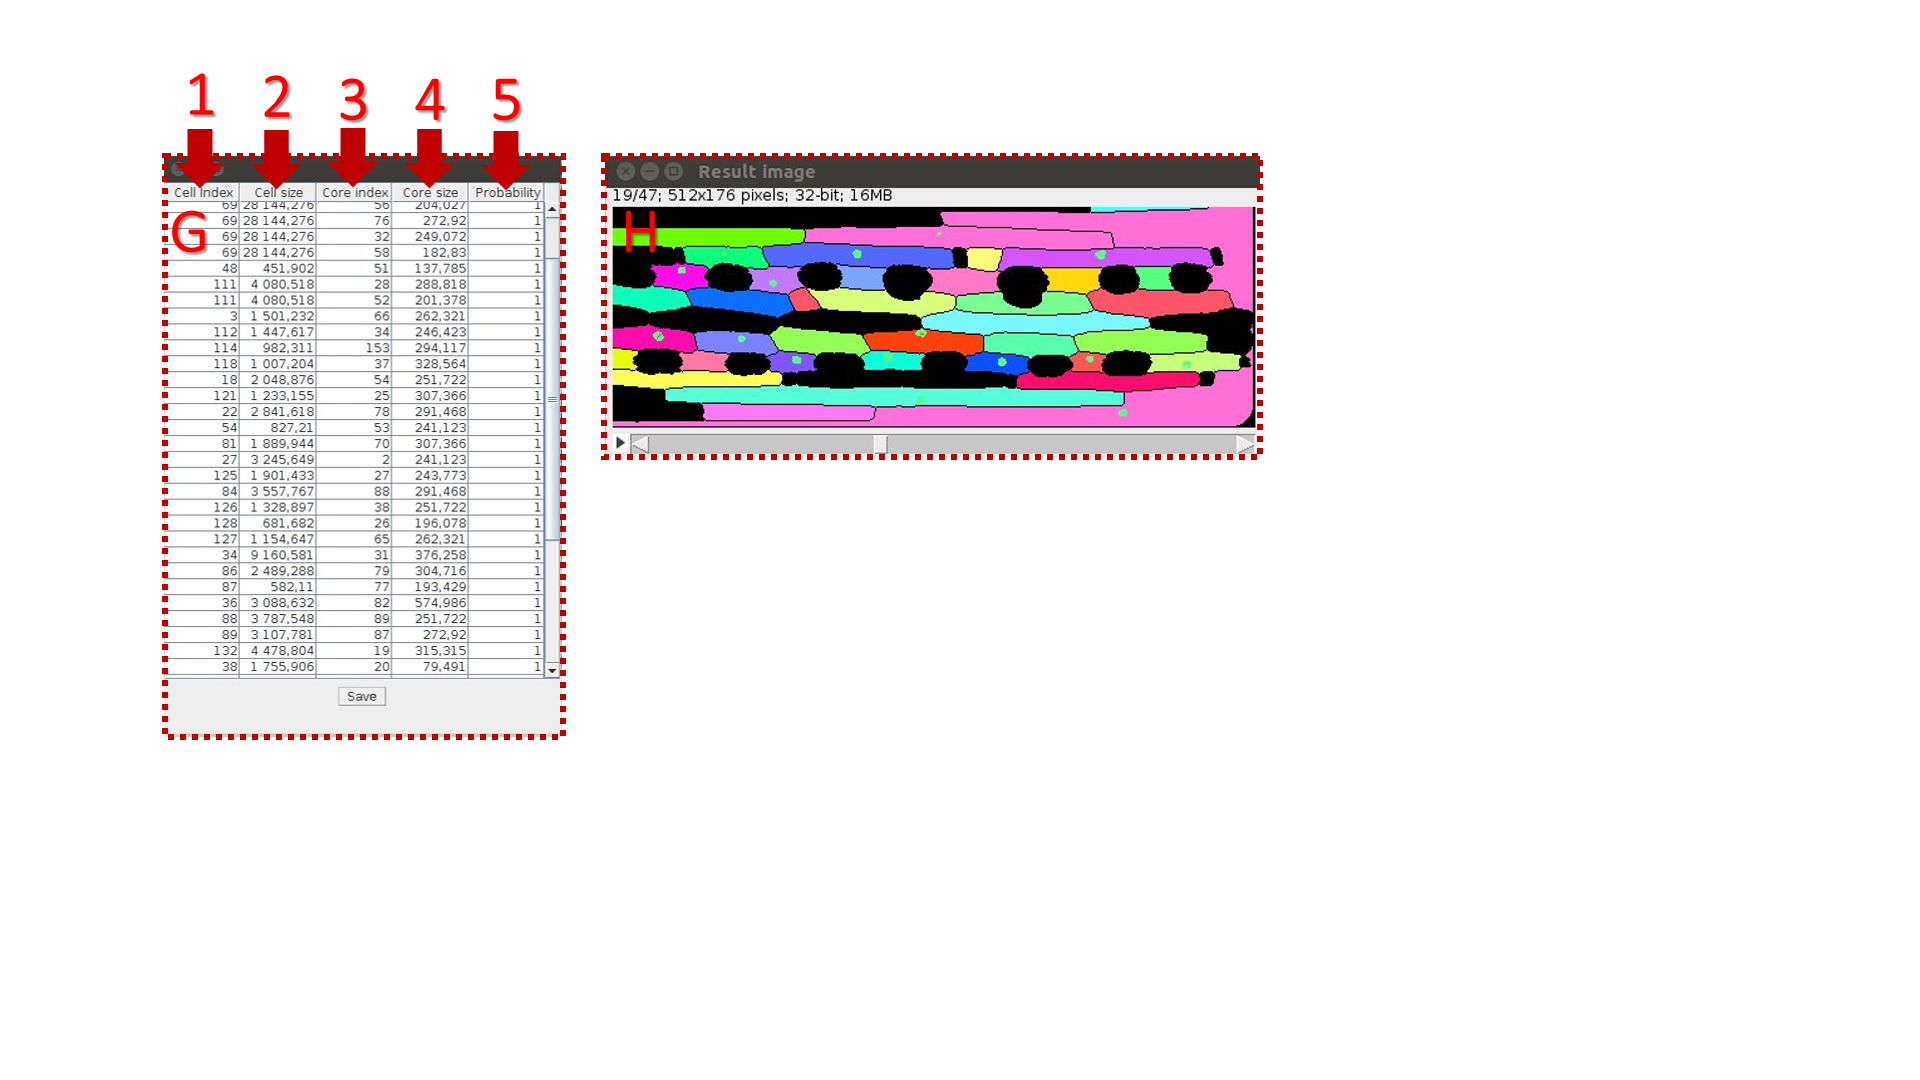
G. Table columns:
1. cell number;
2. cell volume;
3. nucleus number;
4. nucleus volume;
5. fraction of pixels laying into the cell area. When there are mistakes in segmentation, the value P is less then one.
, where k is quantitate of cell’s pixels; n is quantitate of pixels into the inner cell area. In the case of incomplete overlapping of the nucleus region by the inner space of the cell p becomes less than one.
H. Resulting image
Test lsm image is available here.
