BigStitcher AutoLoader
Contents
Select the files to include in the dataset
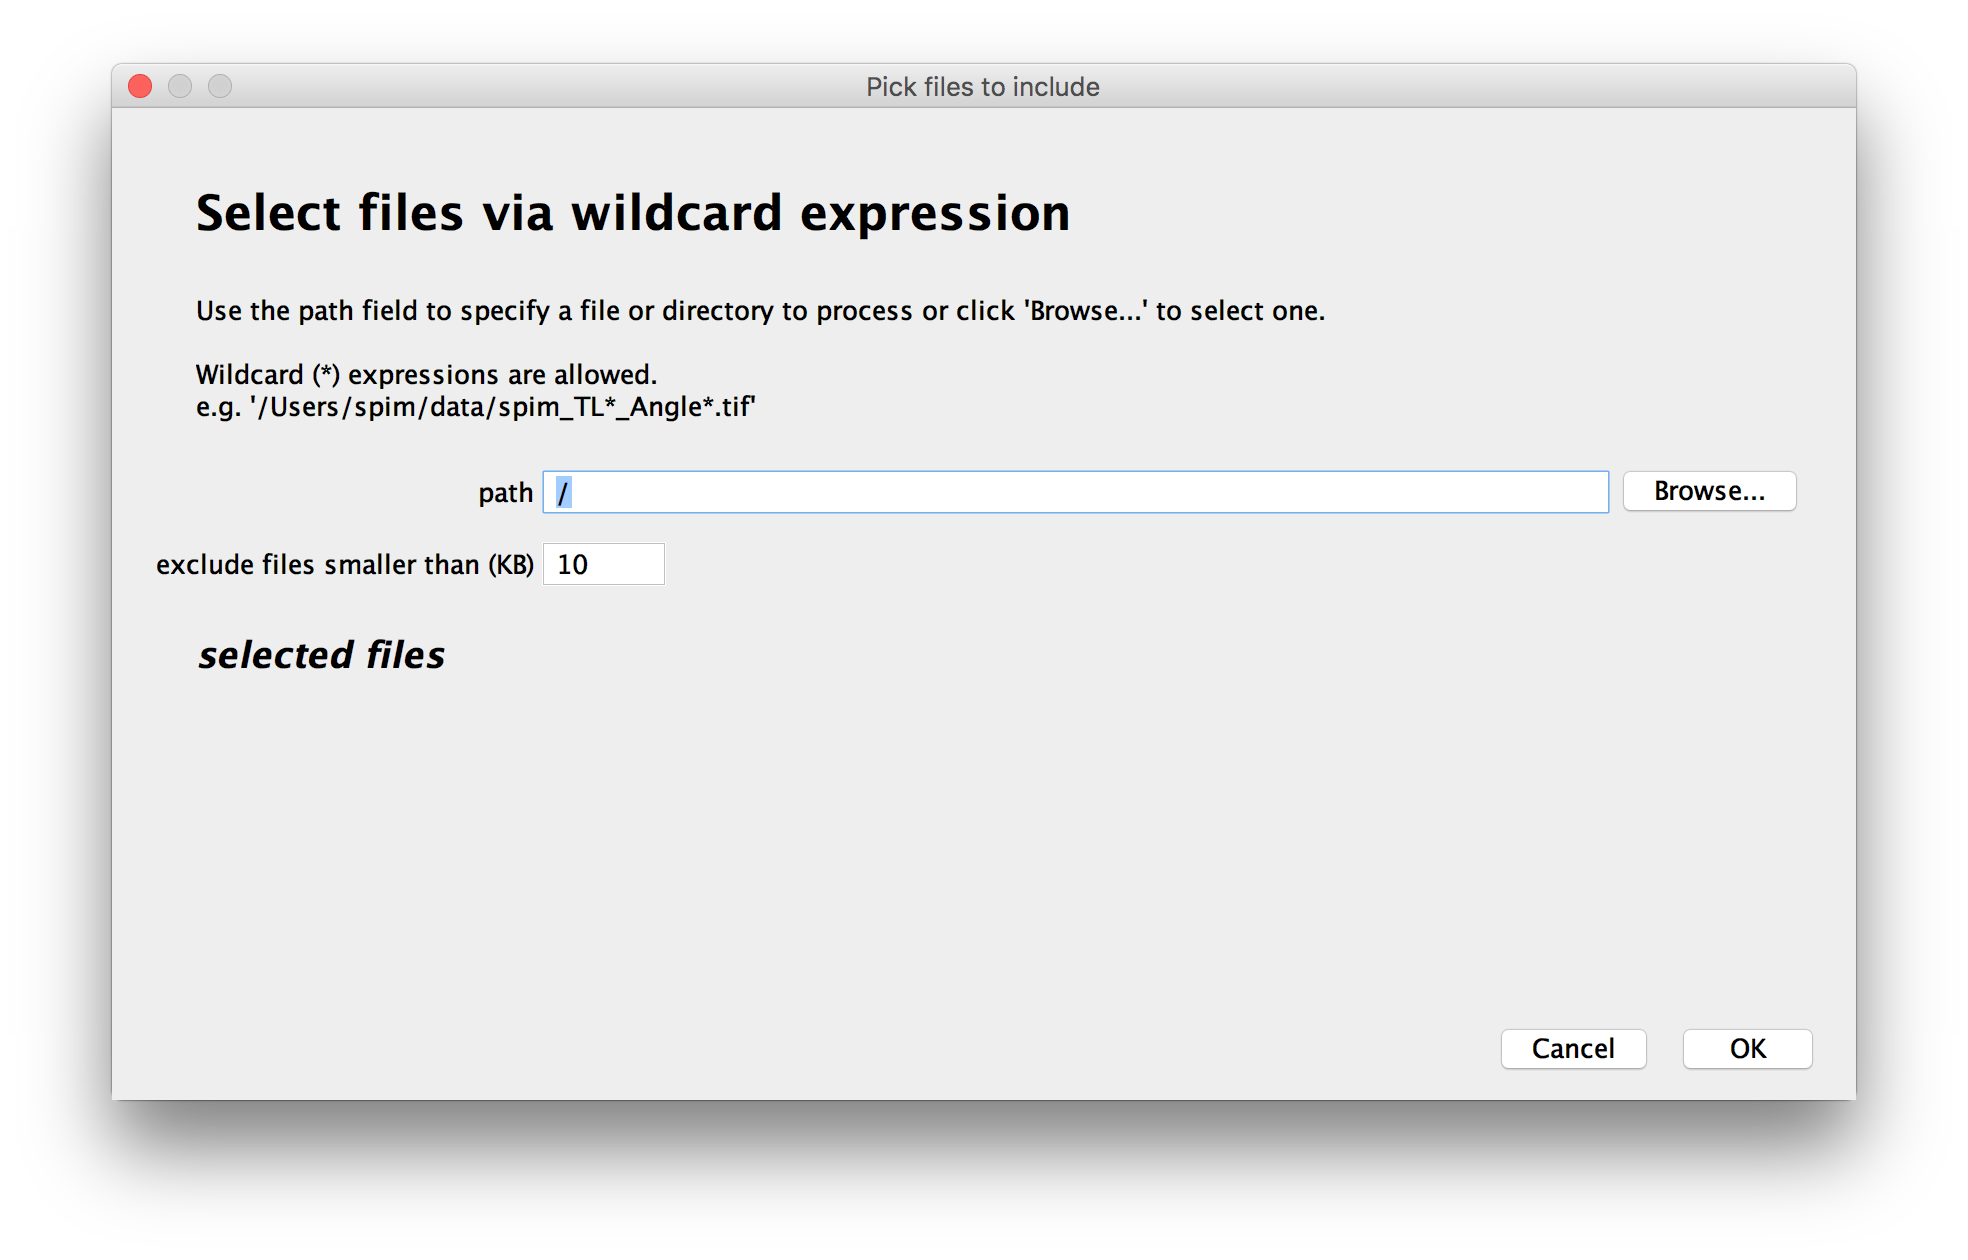
In the first window, you can choose which files to include in the dataset.
You can either Browse for files or directories, drag and drop them to the path-field or enter a path manually.
To include multiple files in the dataset you can:
- Select a directory as the path - in that case, all files in that directory (except for the ones filtered out by size) will be included.
- Use wildcards in the path. The Automatic loader supports glob-Syntax:
- a '*' can be used to specify any sequence of characters
- a '?' can be used to specify a single, varying charcter
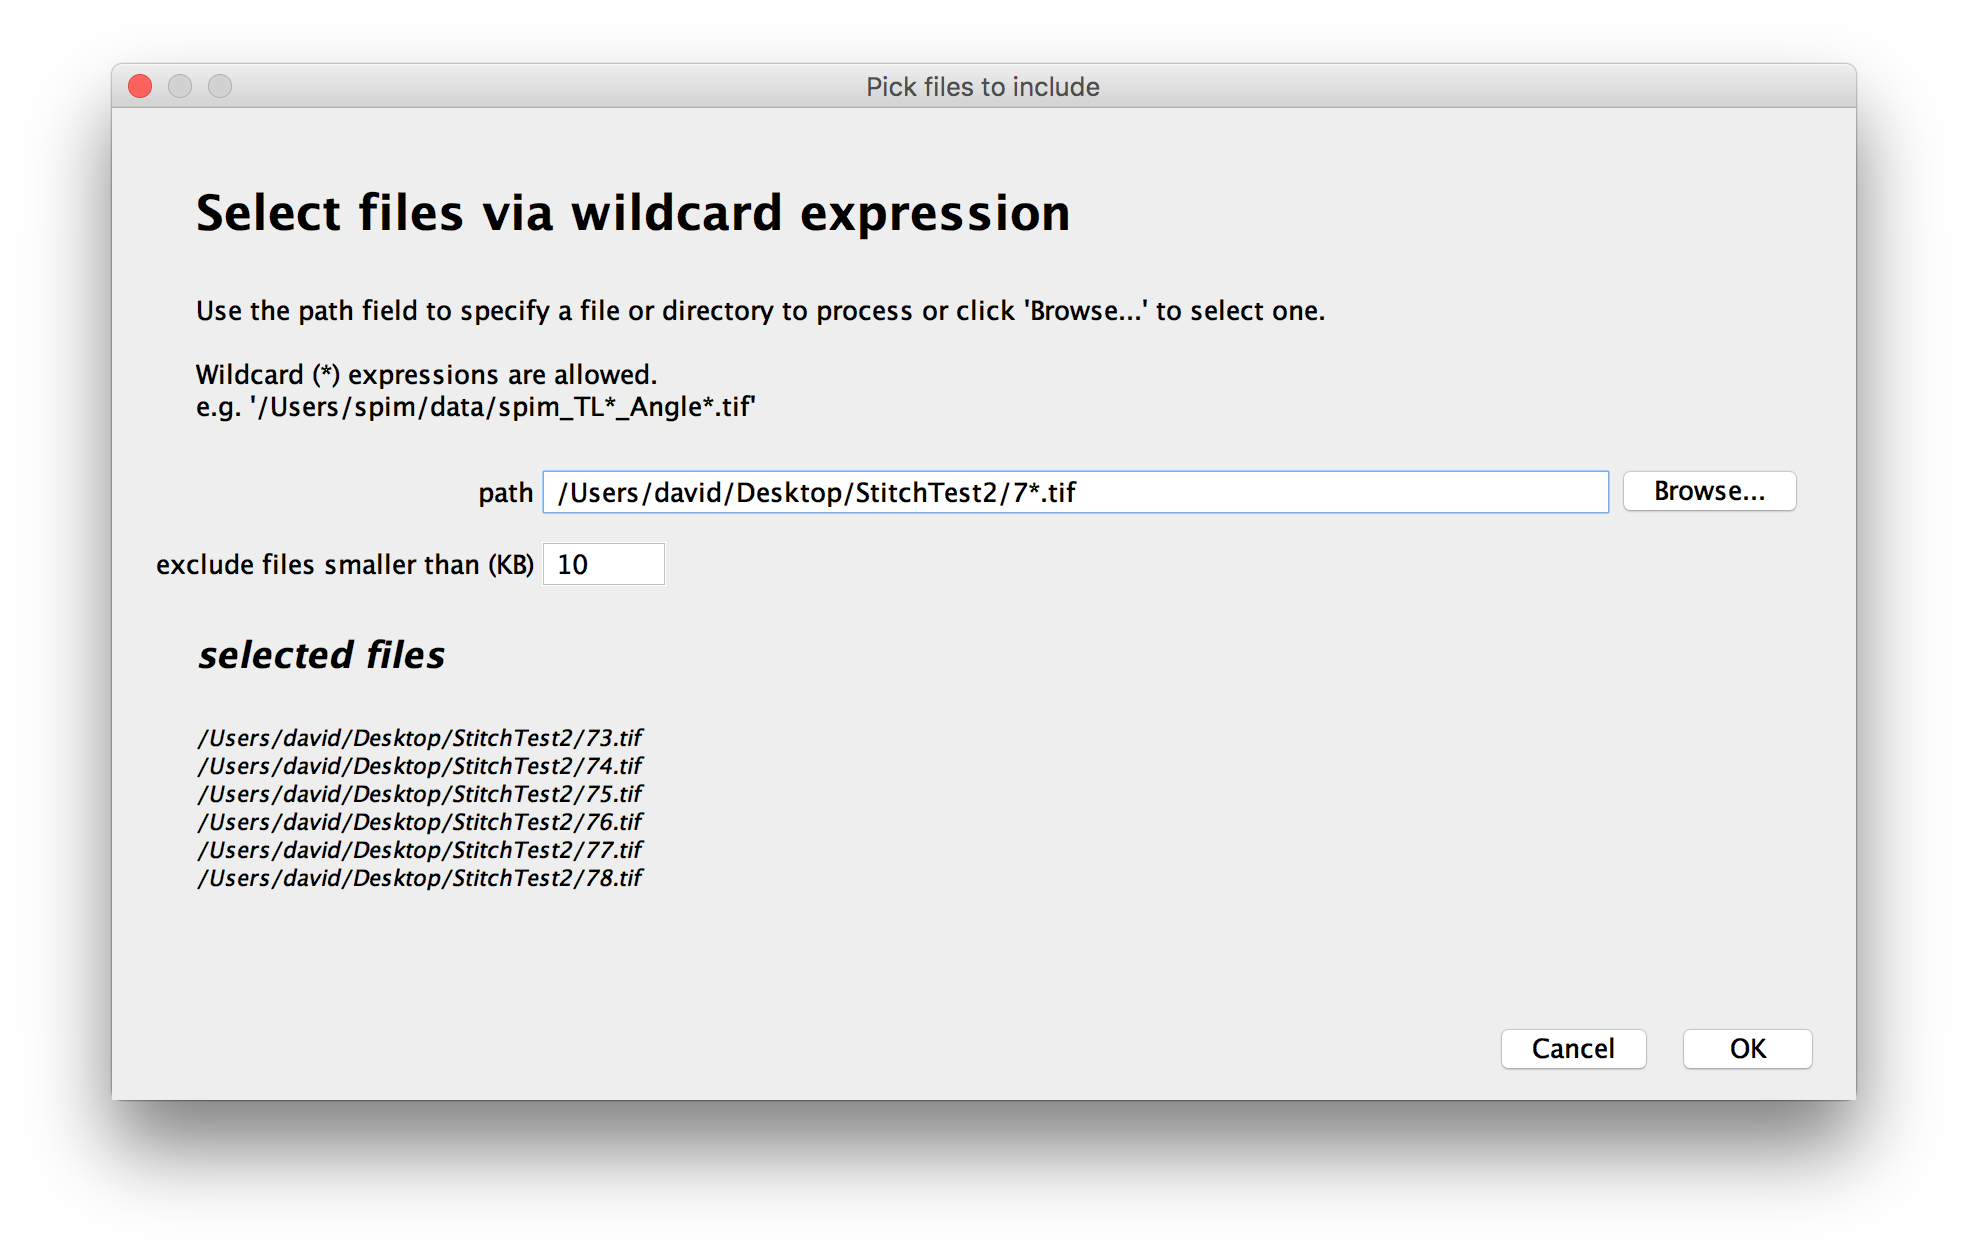
All files that match the pattern you enter will be included in the dataset.
As you change the path and wildcards, a preview of the files to be included in the dataset will be displayed:
To prevent the inclusion of small files like operating-system metadata, you can specify a minimal size for the files to include - smaller files will be ignored (the default of 10KB works fine in most cases).
Assign metadata
After you click OK in the previous window, the Automatic loader will investigate the specified files and try to assign metadata (channel, illumination direction, time point, view angle and tile) to the dataset automatically. This may take some time (typically a couple of minutes for multi-terabyte datasets).
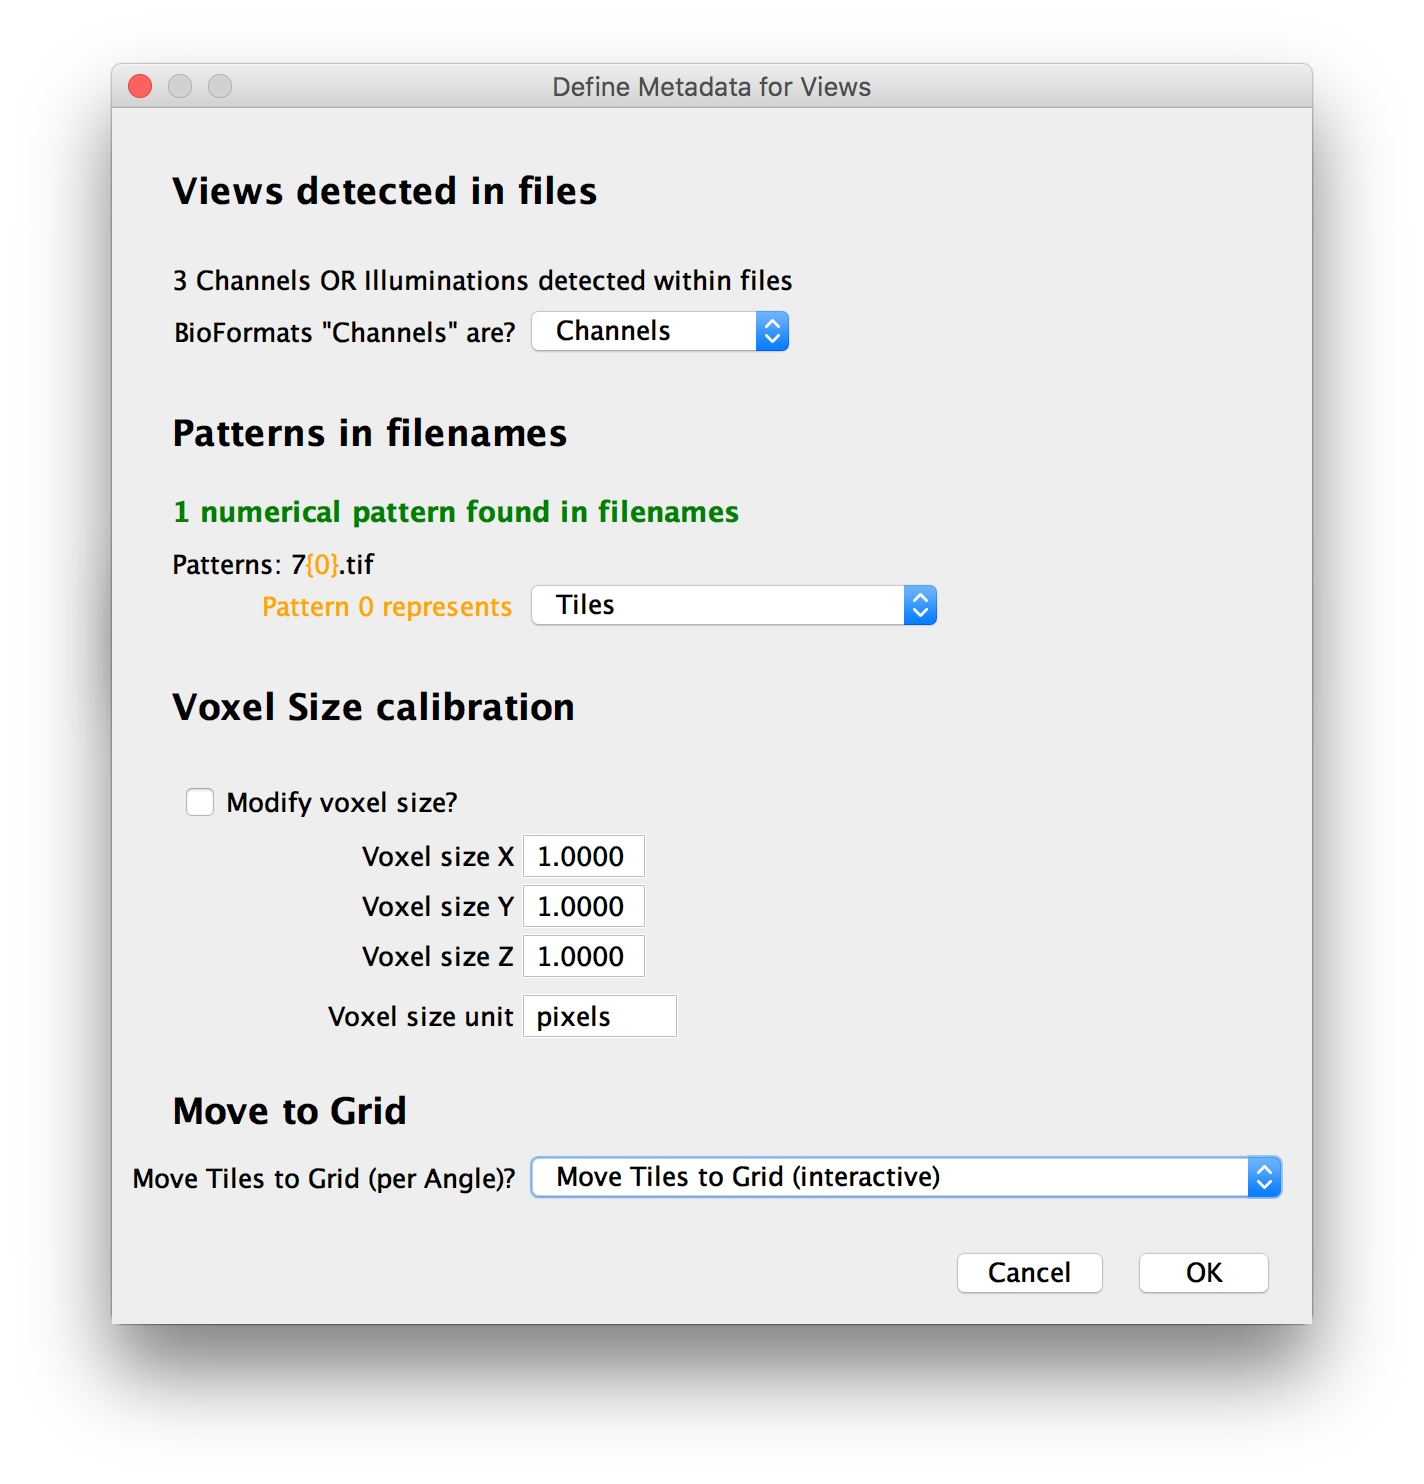
In the next window, you can review and correct the automatic metadata definition:
Views within files
We are using Bio-Formats under the hood. In Bio-Formats, files can include multiple series, each containing multiple channels, time points and z-slices.
The automatic loader tries to assign the stacks to different channels, illuminations, tiles, angles and time points automatically and you can review the choices here.
- if there are multiple Bio-Formats-"channels", but we could not find metadata for them, you will have the option to either assign them to channels or illumination directions.
- if there are multiple "series", but we could not find metadata for them, you will have the option to manually assign them to angles or tiles here.
- time points, if present within files, will be detected automatically.
Patterns in filenames
In addition to metadata within the files, when the dataset consists of multiple files, we can also use numerical patterns in the filenames to represent view attributes. If we could detect patterns in the used files, they will be shown and you can decide what attribute they represent (or choose to ignore them).
Calibration (Voxel size)
We will try to automatically load voxel sizes from the data and display the result here (only the voxel sizes of the first stack in the dataset are displayed).
If no metadata could be found, this will be set to (1x1x1 pixels).
You have the option of manually setting the calibration by ticking the respective checkbox and providing pixel distances along the 3 axes and the unit they are specified in. This will be applied to all stacks in the dataset, so be careful if the calibrations of your stacks differ (a warning will be displayed here in that case).
Move to regular grid
Finally, if we could not find the locations of the individual tiles in the metadata, you can choose to move the stacks into a regular grid here. Possible actions are:
- Do not move Tiles to Grid (use Metadata if available)
Leaves the tiles where they are. This will be selected by default if we could find tile locations in the metadata.
- Move Tiles to Grid (interactive)
Start Move tiles to regular grid manually once the dataset import has been completed. The process will be done once per view angle, if the angle contains more than one tile. This will be selected by default if we could not find tile loactions in the metadata.
- Move Tile to Grid (Macro-scriptable)
A simpler and less interactive, but Macro-scriptable version of the above. You will be queried for the grid parameters for every view angle once you click OK.
(Optional) Move Tile to regular grid (Macro-scriptable)
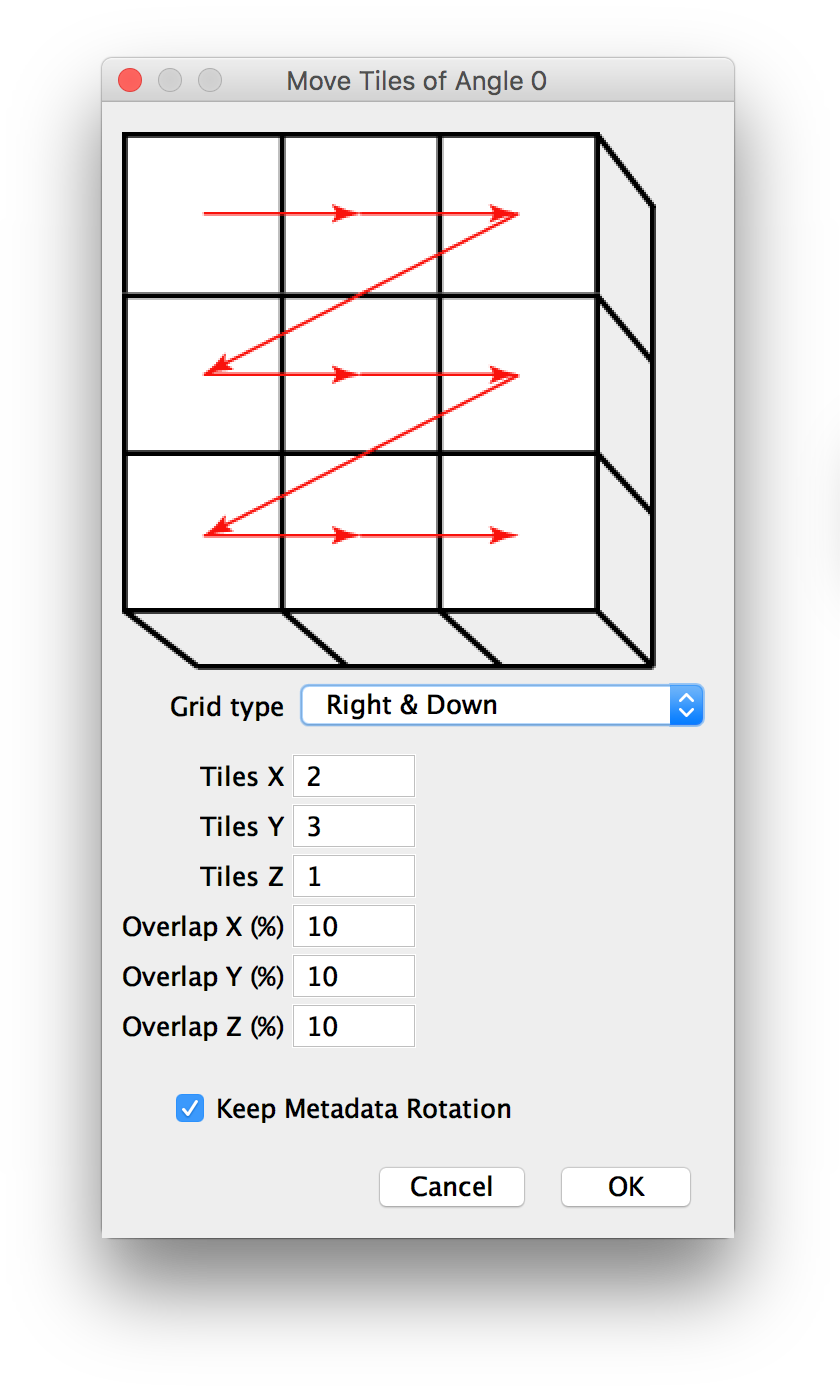
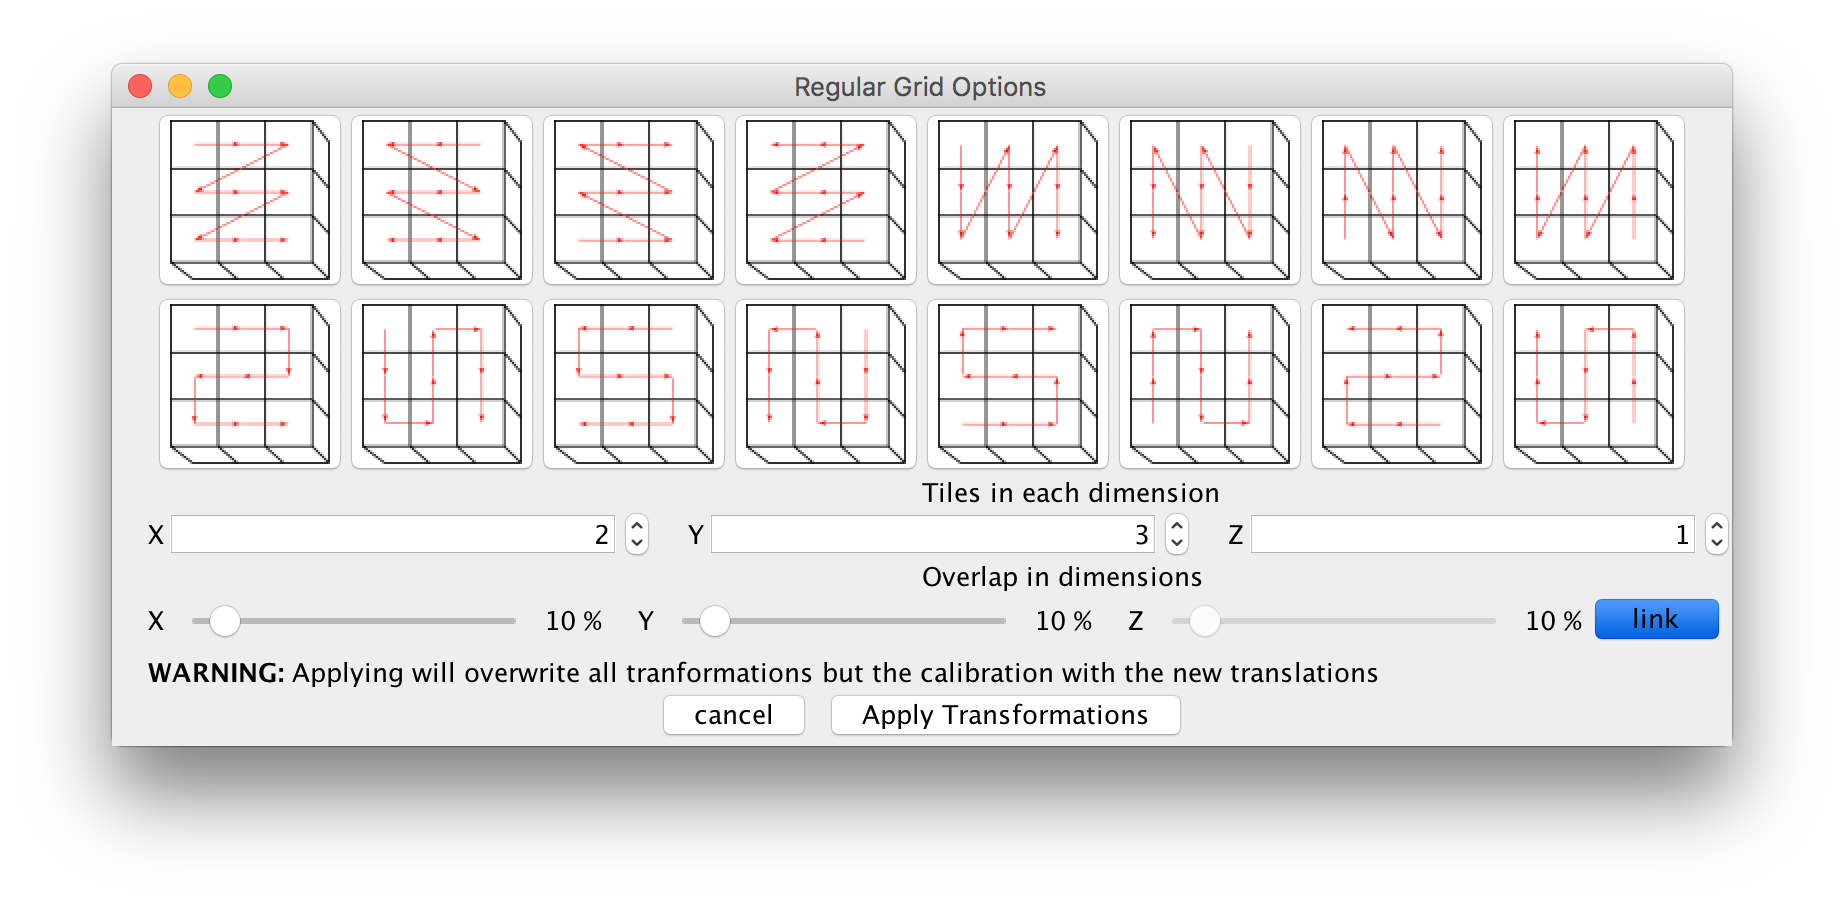
If you selected to move tiles to a regular grid manually, you will be presented with a dialog to specify the parameters of the grid, i.e. the pattern of the tiles, how many tiles there are and by how much they overlap (details).
If there are multiple angles in the dataset, the dialog will be shown for each of them.
If you specify more than one layer in z, the x and y pattern will be repeated for every layer.
Loading/Re-saving option
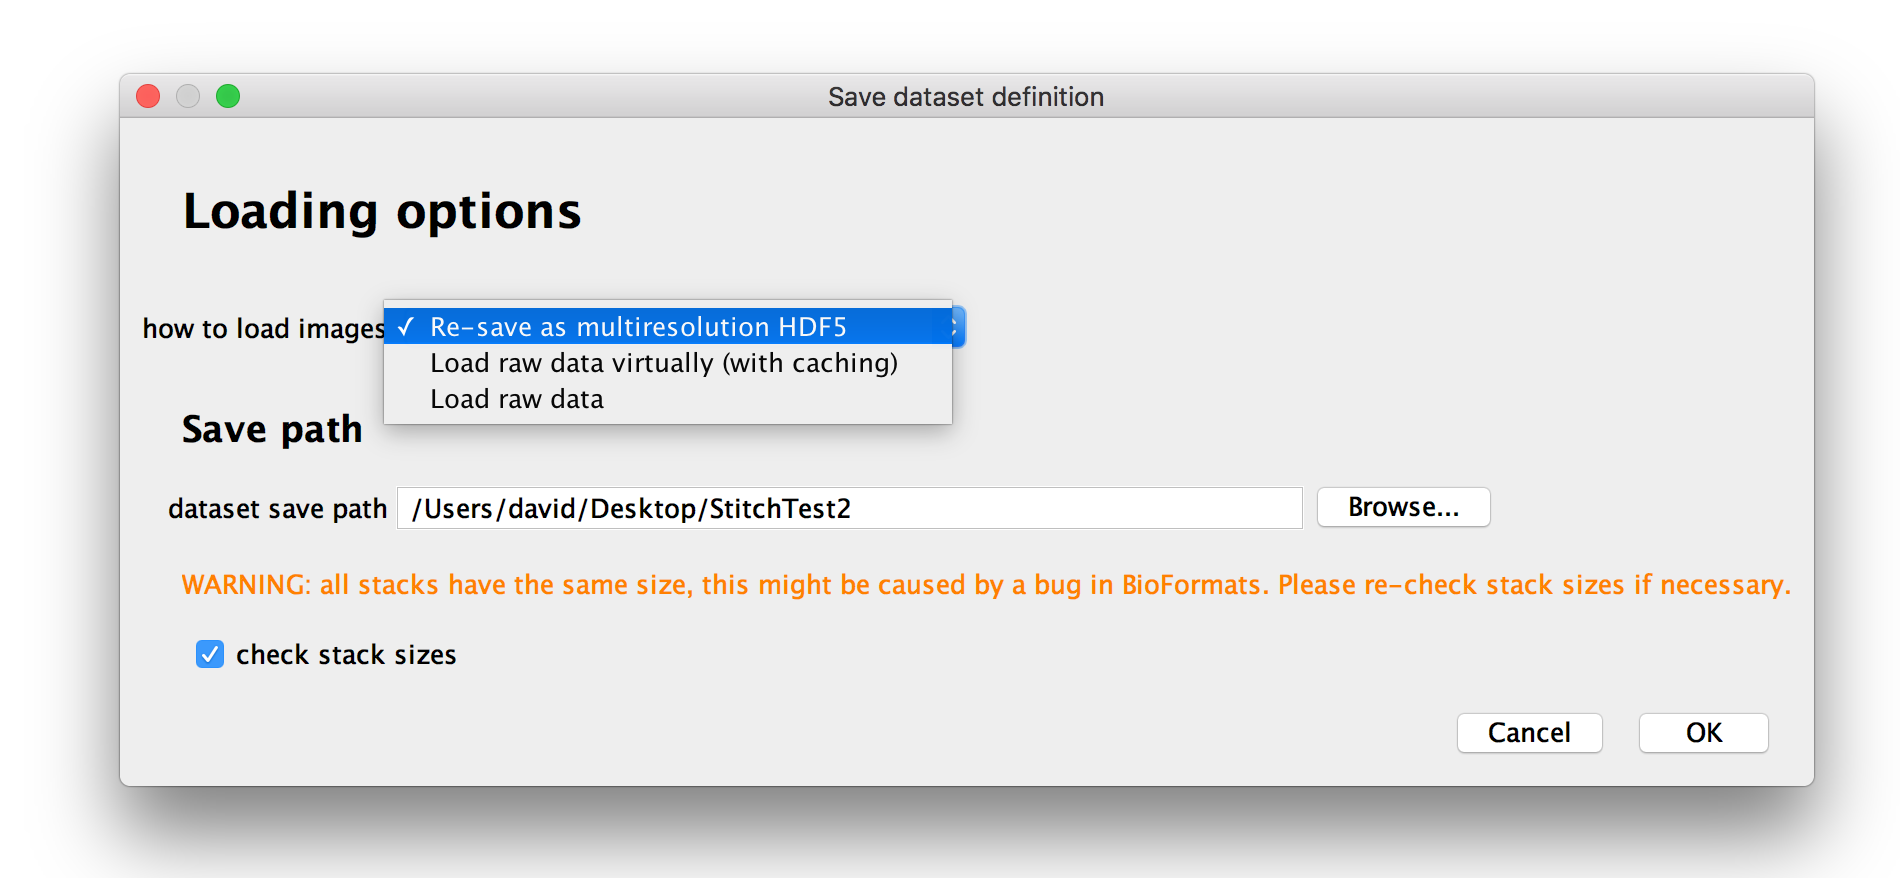
After you have assigned attributes to the images in your dataset, you will be presented with option for how you want to load the data.
Under how to load images, you can choose how to load your dataset:
- If you select Load raw data, images will be fully loaded every time you access them. You can use this for small datasets, but for large datasets this can become prohibitively slow.
- If you select Load raw data virtually (with caching), images will be loaded plane-by-plane as-needed (with caching of previously loaded planes if you have enough memory). This is useful if you want to have a quick look at a very large dataset, but will come with a slight performance hit. We recommend to re-save the dataset as multi-resolution HDF5 as you start to work on it (this can be done later on as well).
- You can also choose to Re-save as multiresolution HDF5 immediately. We recommend you do this unless you just want to have a quick look at the data. The data can also be resaved as multiresolution HDF5 later on.
If your raw data are stored as multiple stacks per file, a bug in BioFormats will cause them to always have an equal number of z-slices. All stacks will have the size of the largest stack and smaller stacks will be filled up with zeroes. Ticking check stack sizes will cause BigStitcher to load all stacks and remove the zero-valued volume at the end of each stack.
You will also be able to specify the dataset save path, i.e. the directory the XML dataset definition (and HDF5 file if you choose to re-save immediately) will be saved to.
Options for re-saving as HDF5
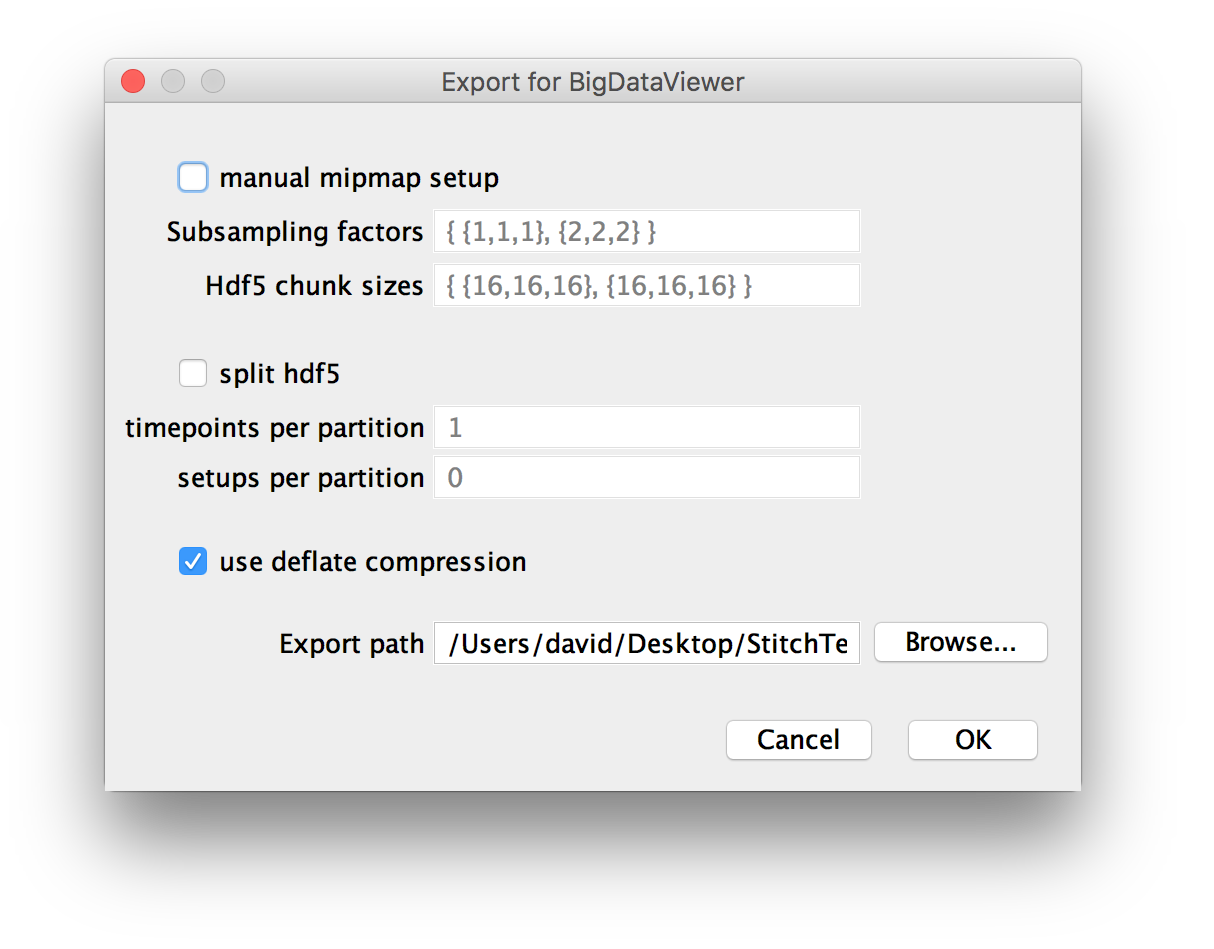
If you chose to resave your dataset as HDF5 in the previous dialog, you will be presented with options for the creating the multi-resolution pyramid and saving it. For an in-depth explanation of the options, have a look at the BigDataViewer documentation.
- manual mipmap setup allows you to specify the subampling factors in the form
{subsampling factor in x, subsampling factor in y, subsampling factor in z}, e.g.{1,1,1}for the original images. The multiple subsampling factors have to separated by commas and placed between brackets. Furthermore, the data will be split into chunks, e.g. 16x16x16 pixels. You can specify the chunk size per subsampling level in the same format as the subsampling factors. Generally, we try to pick meaningful defaults here, so you should not have to change these settings.
- split hdf5 allows saving the dataset to multiple files (by default, it is saved to one big file). You can choose the number of time points and setups (views within time points) per file here (
0means no splitting). You can use this if your filesystem places limits on file sizes.
- You can tick to use deflate compression for lossless compression of your output. If your original data are uncompressed, this may greatly reduce the size of the written files, to a point that the resaved data are actually smaller than the original data (on the other hand, not compressing when you have compressed raw data will increase the output size). Since the performance hit of decompressing data is small and IO bandwidth is much likelier to be a bottleneck, we recommend you compress the HDF5 file
- Finally, you can choose the export path, i.e. the directory the .h5 file(s) are saved to.
(Optional) Move Tiles to regular grid interactively
If you selected Move Tiles to Grid (interactive) earlier on, a BigDataViewer window will open at this point and display the images in your dataset.
You will be presented with a dialog to specify the parameters of the grid, i.e. the pattern of the tiles, how many tiles there are and by how much they overlap. The effects of your settings will be displayed in the BigDataViewer window and updated on-the-fly (details).
As with the macro-scriptable version of this dialog, if there are multiple angles in the dataset, the dialog will be shown for each of them and if you specify more than one layer in z, the x and y pattern will be repeated for every layer.
Go back to the dataset definition overview
Go back to the main page
