| Author: | Michael Mohn and Jannik Meyer University of Ulm, Germany email at jannikmeyer dot de |
| Source: | Asymmetry_.java Released under the GNU General Public License. |
| Installation: | Download Asymmetry_.class to the plugins folder, or subfolder, restart ImageJ, and there will be a new "Asymmetry" command in the Plugins menu or submenu. |
| Description: | This plugin allows an automated analysis of variations in
imaging conditions across the field of view in high-resolution TEM
images (see http://arxiv.org/abs/1006.0712, section XIV). Simple usage: Open the HRTEM image of choice. For the hexagonal structure, hexagons should be dark, the center of the hexagon white (maximum intensity). Multiply by -1 if your contrast is reversed. Try with the example image: 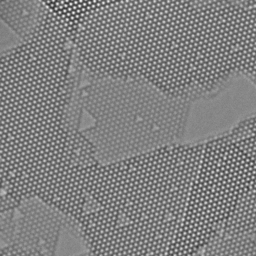 Convert to 32bit. Up-scale by a factor of 4 to minimize pixelation artefacts (atom spacing should be at least 12 pixel in our experience). Cut away the high-frequency information in a Fourier filter to reduce pixel noise (FFT, draw circular mask, Edit-> clear outside, Inverse FFT). Here we cut just outside the first lattice reflection: 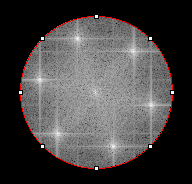 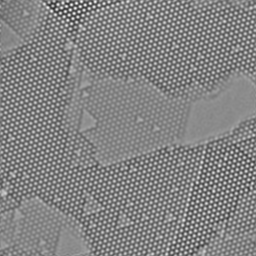 Measure atomic spacing and angle (of course, measure a multiple of this length and divide, for better accuracy). For our example of Single-layer hexagonal boron nitride (hBN), we chose to define the vector from the center of the hexagon to the element which forms stable mono-vacancies. In this way, the sign of the asymmetry is defined. Run the asymmetry plugin. Enter angle and atom spacing as displayed in ImageJ when you draw a line as for the yellow arrow of the following image (all defaults should work for the example image after above steps). Click OK. Input box "Hexagon radius" should usually be the same as atomic spacing (default).  Now, from each image point, the plugin will search for the nearest intensity maximum (within the given mask). It will then measure intensity at this maximum point (center of the hexagon) and on sub-lattices A and B (away from the center by +- the given vector, arrow and dashed line in above illustration). If "use mean value of 3 neighbored atoms" is activated, it will use the average of the three neighbours for each sublattice (red and green circles above). Note that, in this case, the result from neighbouring unit cells is not statistically independent. The result shows variations in imaging conditions across the field of view. The "Rainbow RGB" color map is used here: 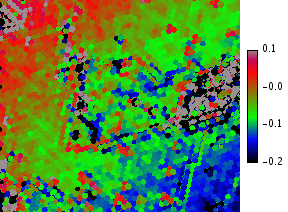 Advanced usage: * Activate "show images with min and max" displays images with intensities for each sublattice. An image generated as 2*Max -Min1-Min2 (e.g.) can be used to asses layer thickness (total contrast): 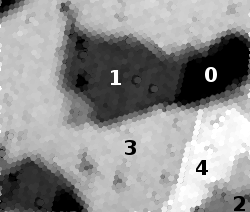 * Separate images can be used for location of intensity maxima and actual measurement. In particular for noisy data, it is useful to generate a Fourier filtered copy of the image with enhanced periodic components and select this image for "maxima positions". * A stack of images can be used as input, e.g. to monitor variations with time in image sequences. * Arbitrary user-generated images can be used as unit cell mask (e.g. for non-hexagonal structures). The mask must consist of values 0 and 1 only. |