Mach Bands
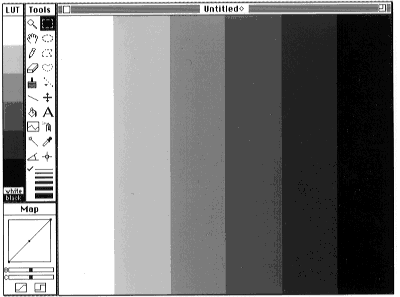
To generate Mach bands, first open a blank window using the File - New command. Then select the entire window using Edit - Select All , and fill it with a gray level ramp using Edit - Draw Scale . After setting the number of gray levels to a number, such as 6, with Options - LUT Options , the ramp will appear as a series of stripes, which appear slightly shaded like Venetian Blinds (Fig. 16). The bars are actually uniform, as can be seen by covering up all but one bar, by using the line profile tool, by inspecting the Info window while moving the cursor over the bars, or by doing a mesh plot using Analyze - Surface Plot . Notice that it is necessary to use Process - Apply LUT before profile plots and mesh plots show the bands. The Mach bands are caused by the abrupt intensity change at the edges, which the eye further enhances.

Often, annotated gray scale wedges or color bars are used to infer numerical values
from images using the gray scales or colors. In some instances, in particular when
a more natural or smooth color scale is used, this can be prone to error.
To show the illusion, fill a window with a gray level ramp as with the Mach Band
illusion. If the 'crawling ants' border is still there, get rid of it either with
Edit - Deselect All
or by clicking on the image with any tool except the four to the upper right.
Then select the rectangular selection tool, and click and drag it to create a small
rectangular selection. Copy the selection and paste it back where it was using
Edit - Copy
and Edit - Paste
.
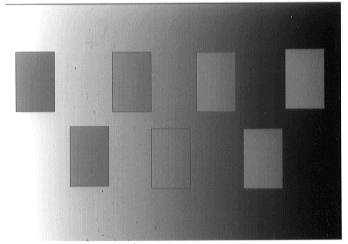
The selection can now be moved about the window by dragging it with the mouse -
do not click outside this region until you are finished. The selection will appear
to change in brightness as it is moved across the ramp. If it is pasted in various
places on the ramp, it will appear to have different gray levels, which in fact it
does not. (Fig. 17). The illusion persists when using natural color scales such
as the thermal scale (Fig. 18) which is applied using the Options - Color Tables - Fire 1
command. The illusion does not persist, however, when using color scales such
as the spectrum color scale (Fig. 19), applied using the Options - Color Tables - Spectrum
command that the eye perceives as 'op art' rather than as a shaded image.
If our perception of gray levels is faulty here, then our perception is also likely to be faulty when 'matching' gray levels in an image to a gray ramp or color bar.


