Online Manual for the
MBF-ImageJ collection

5. Particle Analysis
Particle counting can be done automatically if the specimen lends itself to it, i.e. the individual particles can touch – but not too much! If automatic particle counting cannot be done, ImageJ can facilitate manual counting with the “Point Picker” or “Cell counter” plugin.
5.1 Automatic Particle counting
The biggest issue is one referred to as “segmentation” which is to distinguish the object from the background. Once the objects has been successfully segmented, they can then be analysed.
RAW Threshold Watershed “AnalyzeParticles” Merge

5.1.1 Setting a threshold
5.1.1.1 Manual thresholding
Automatic particle analysis requires the image to be a “binary” image i.e. black or white. The software needs to know exactly where the edges are to perform morphology measurements. A “threshold” range is set and pixels in the image whose value lies in this range are converted to black; pixels with values outside this range are converted to white (or vice-versa depending on what the user requests).
|
|
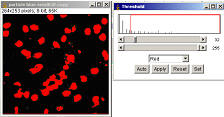
There are several ways to set thresholds. For monochrome images it is most simply done via thee menu command “Image/Adjust/Threshold”. While the threshold is being set, the pixels within the threshold range are displayed in red. The user then changes then “Apply” the threshold and the image will be converted to a binary image. |
 For
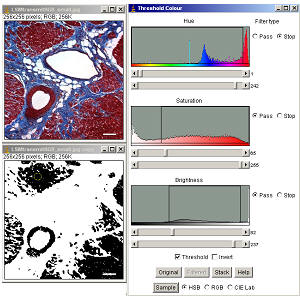
colour images, setting the threshold is a bit more complicated as each of the
red, green and blue channels require different threshold ranges. The plugin “Plugins/Colour
functions/Threshold Colour”
can be used to do this most easily. This opens a fairly complicated and
extensive control window. The simplest way to perform a colour threshold is to
use one of the selection tools to select one of the objects of interest, and
then click the “Sample” button in the “Threshold Colour” control
window. This should remove the pixels in the image that do not have pixels of
the same colour as those in the selection. The thresholding can be manually
tweaked with scroll bars in the histogram panes. It may be easier to
conceptualise what you are doing at this point by switching the Control window
from the default Hue, Saturation and Brightness colour model to red, green blue
model by switching the option buttons at the bottom of the control window. The
image can be displayed as a binary image with the “Threshold” button, and
converted to a binary image via the menu command “Image/Type/8-bit” (?!).
For
colour images, setting the threshold is a bit more complicated as each of the
red, green and blue channels require different threshold ranges. The plugin “Plugins/Colour
functions/Threshold Colour”
can be used to do this most easily. This opens a fairly complicated and
extensive control window. The simplest way to perform a colour threshold is to
use one of the selection tools to select one of the objects of interest, and
then click the “Sample” button in the “Threshold Colour” control
window. This should remove the pixels in the image that do not have pixels of
the same colour as those in the selection. The thresholding can be manually
tweaked with scroll bars in the histogram panes. It may be easier to
conceptualise what you are doing at this point by switching the Control window
from the default Hue, Saturation and Brightness colour model to red, green blue
model by switching the option buttons at the bottom of the control window. The
image can be displayed as a binary image with the “Threshold” button, and
converted to a binary image via the menu command “Image/Type/8-bit” (?!).
5.1.1.2 Automatic thresholding
One concern with setting a threshold manually is the potential to introduce user-bias. There are many algorithms described to automatically calculate the threshold. A evaluation of over 40 of these can be found in this paper: Sezgin & Sankur. 2004. Survey over image thresholding techniques and quantitative performance evaluation. Journal of Electronic Imaging, 2004. (13:146-165). MBF ImageJ has several plugins found in the menu "Plugins/Segmentation" for automatic calculation of an image threshold. These include Otsu's thresholding, maximum entropy threshold, mixture modelling thresholding. There is also k-means clustering which can segment an image in to multiple bands and can be used with colour images.

5.1.2 Watershed separation
Objects in a binary image that are slightly overlapping may be separated using the menu command “Process/Binary/Watershed”. This segmentation process is nicely illustrated with this figure from the ImageJ documentation web pages (http://rsb.info.nih.gov/ij/docs/index.html).
The image first needs to be converted to binary (set via thresholding). The black pixels are then replaced with grey pixels of an intensity proportional to their distance from a white pixel (i.e. black pixels close to the edge are light grey, those closer to the ‘middle) are nearer black. This is the Euclidian distance map (EDM). From this it calculated the centres of the objects the ultimate eroded points (UEPs), i.e. points that are equidistance from the edges. These points ere then dilated until the meet another black pixel, then a watershed line is drawn.
5.1.3 Analyse Particles
Once
the image has been segmented, the menu command “Analyze/Analyze particles”
can be used to obtain various information regarding particle size and numbers.
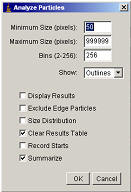
Set the minimum size and maximum size to exclude objects that appear in the binary image that are clearly not objects of interest. Select the “Show: Outlines” option to display an image of the detected objects. This can then be merged with the original for presentation purposes. Invert the outline image and use the menu command “Plugins/Colour functions/Colour merge” to add the original and outline image.
The particle analysis can be automated via plugins or macros once the correct threshold value and particle size range has been determined for your objects of interest. See the “Plugins/Particle Analysis/ Nucleus counter” plugin and its source code to customise it to your images.
5.1.4 Nucleus Counter
This plugin automates many of the steps discussed above. The user can:
1. Enter the size range which should be counted.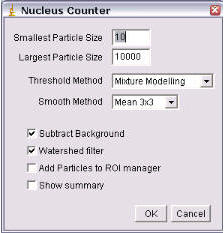
2. Select the automatic thresholding method. This can be either "Current", "Otsu",
Maximum Entropy", "Mixture Modelling" or k-means" clustering. "Current" uses the
threshold that has been set manually, see above.
3. Opt to perform a background correction.
4. Opt to perform a "Smooth" filter.
5. Opt to perform a watershed separation.
6. Opt to add the particles to ROI manager
7. Opt for a summary.
Other options can easily be added on request.
The count, area and average size are returned as a text window and the outlined particles are overlaid on a duplicate of the original image.

5.2 Manual Counting
You can use the ImageJ toolbar Crosshair (mark and count) tool to count particles. However, a greater degree of control can be accessed with the “Point Picker” or “Cell counter” plugin.
5.2.1
Cell
Counter
When then “Plugins/Particle counting/Cell Counter” plugin) is run, a new Image window is generated with the original image plus four buttons along the bottom (Red type, Green type, Blue type and Yellow type). Clicking on a button changes the colour of the marking tool. The results table keeps a tally of the number of each of the cell types marked. Clicking the Results button will generate a summary of the data.
5.2.2 Point Picker
“Plugins/Particle counting/PointPicker ”. Running this plugin will change the ImageJ toolbar to the PointPicker toolbar (below).

Crosses
are reversibly overlaid on to the image, incrementally changing colour (this
differs from the Crosshair tool which irreversible stamps a point in the
image). With the Point Picker tool, crosses can be moved and deleted. Once
marking is complete, the cross coordinates can be accessed via the
![]() button.
button.
 This
produces the “Point List” dialog allowing you to Show, Save or
Open the points’ coordinates. Clicking “Show” displays the
coordinates in the Results window, where they can be saved or copied to
the system clipboard. Once finished, you can return to the regular ImageJ
toolbar by clicking the
This
produces the “Point List” dialog allowing you to Show, Save or
Open the points’ coordinates. Clicking “Show” displays the
coordinates in the Results window, where they can be saved or copied to
the system clipboard. Once finished, you can return to the regular ImageJ
toolbar by clicking the ![]() button.
button.
5.3 Particle tracking
5.3.1 Automatic Tracking
Particle Tracker
SpotTracker
5.3.2 Manual Tracking
MTrackJ